Fig. 1.
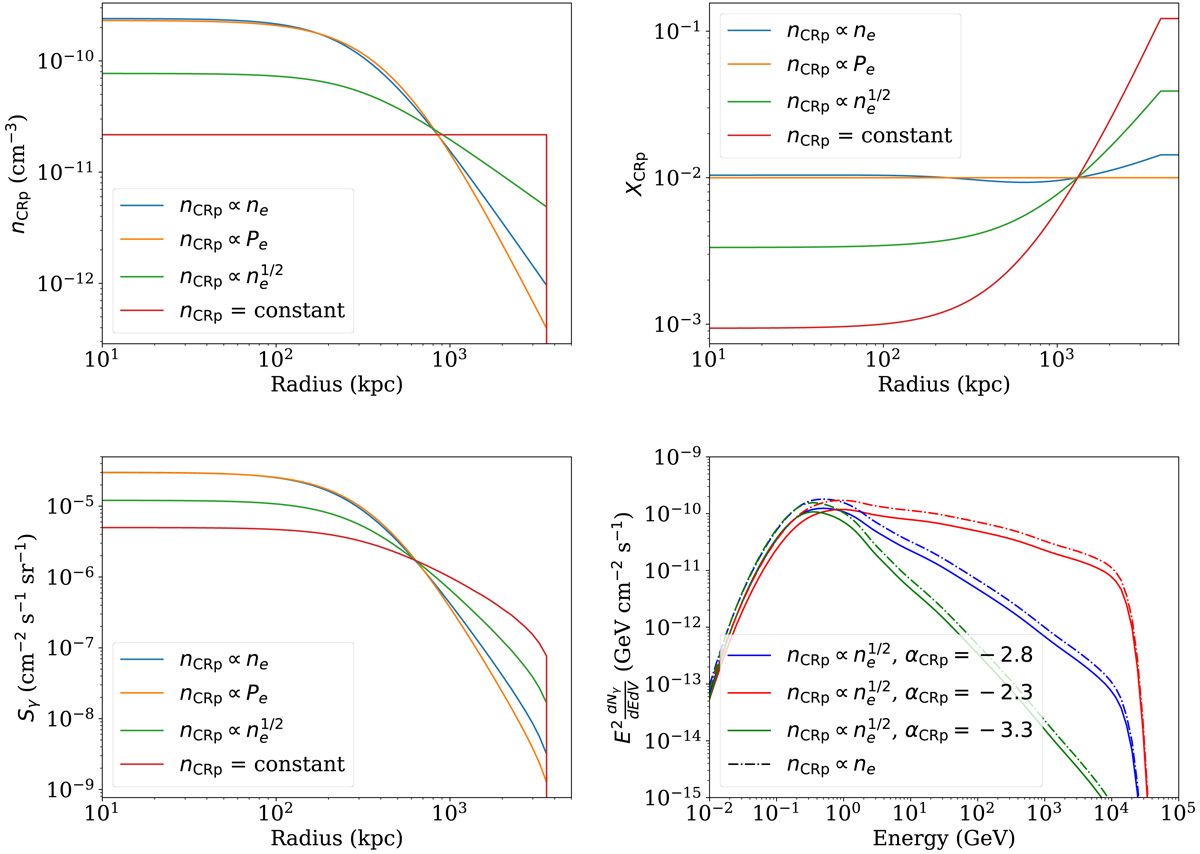
MINOT templates used to describe the cluster, for different assumptions regarding the CRp distributions. All models are normalized so that XCRp(R500) = 10−2. Top left: radial profile of the CRp distribution. Top right: enclosed CRp to thermal energy profile. Bottom left: γ-ray surface brightness profile. Bottom right: γ-ray energy spectrum integrated within R500.
Current usage metrics show cumulative count of Article Views (full-text article views including HTML views, PDF and ePub downloads, according to the available data) and Abstracts Views on Vision4Press platform.
Data correspond to usage on the plateform after 2015. The current usage metrics is available 48-96 hours after online publication and is updated daily on week days.
Initial download of the metrics may take a while.