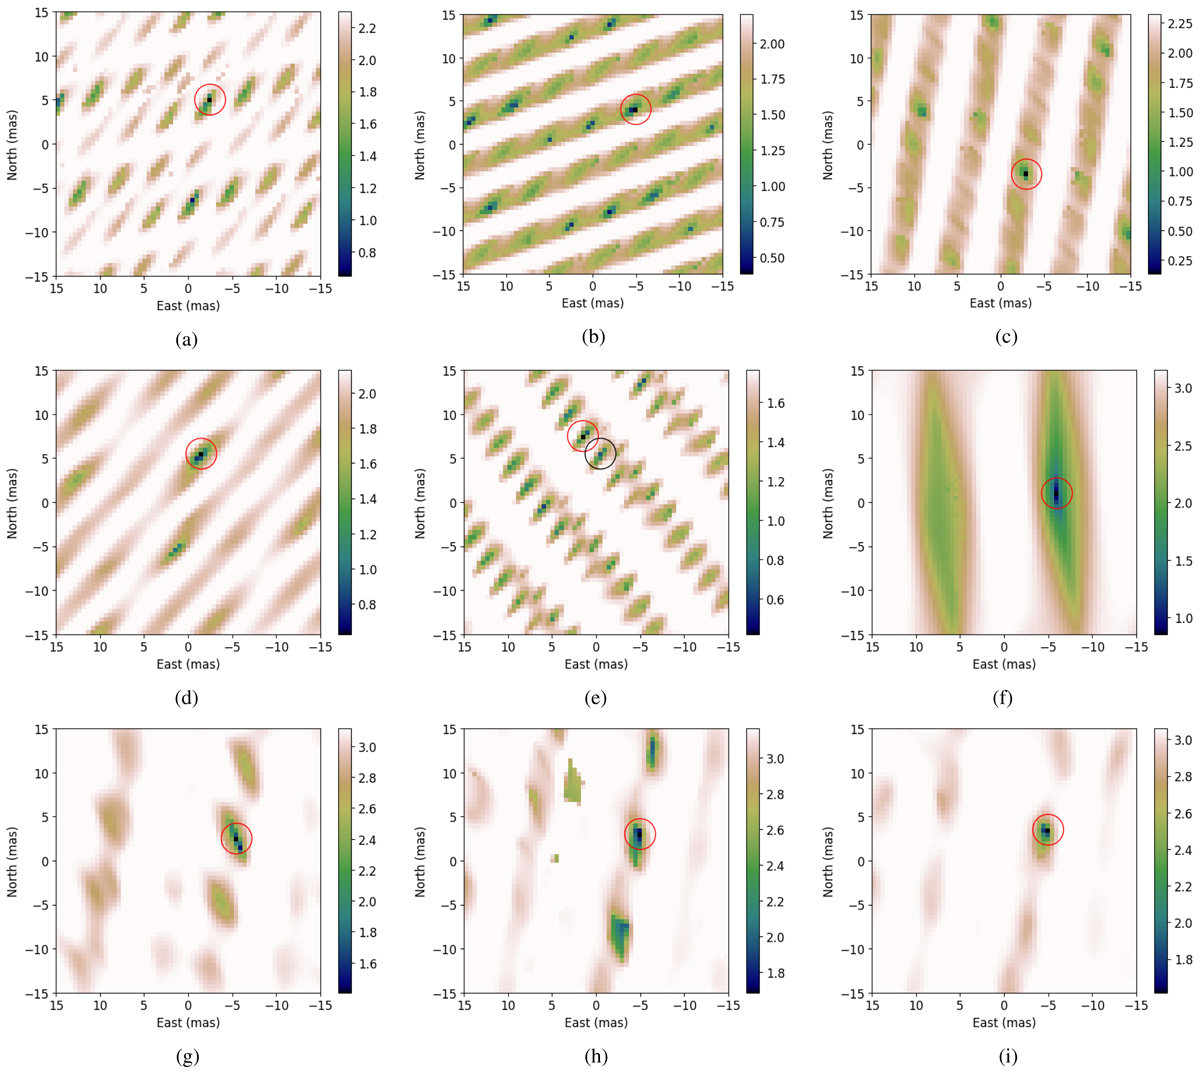
Fig. B.1.
Results of the grid search for the binary position of each epoch. The logarithmic χ2-maps show a cut through the (α, β)-plane, with the best value of flux ratios at each position. The red ellipses show the position of the global minimum on the map, which coincides with the position of the secondary component selected to derive the orbital parameters. The exception is Run E, where the selected position of the secondary (black ellipse) is not the global minimum but a nearby local minimum. (a) 2011-Feb-10 (A). (b) 2012-Mar-06 (B). (c) 2012-Jul-02 (C). (d) 2015-Feb-05 (D). (e) 2015-Feb-13 (E). (f) 2017-Mar-09 (F). (g) 2019-Jun-20 (G). (h) 2020-Jan-28 (H). (i) 2020-Jan-30 (I).
Current usage metrics show cumulative count of Article Views (full-text article views including HTML views, PDF and ePub downloads, according to the available data) and Abstracts Views on Vision4Press platform.
Data correspond to usage on the plateform after 2015. The current usage metrics is available 48-96 hours after online publication and is updated daily on week days.
Initial download of the metrics may take a while.