Fig. 6.
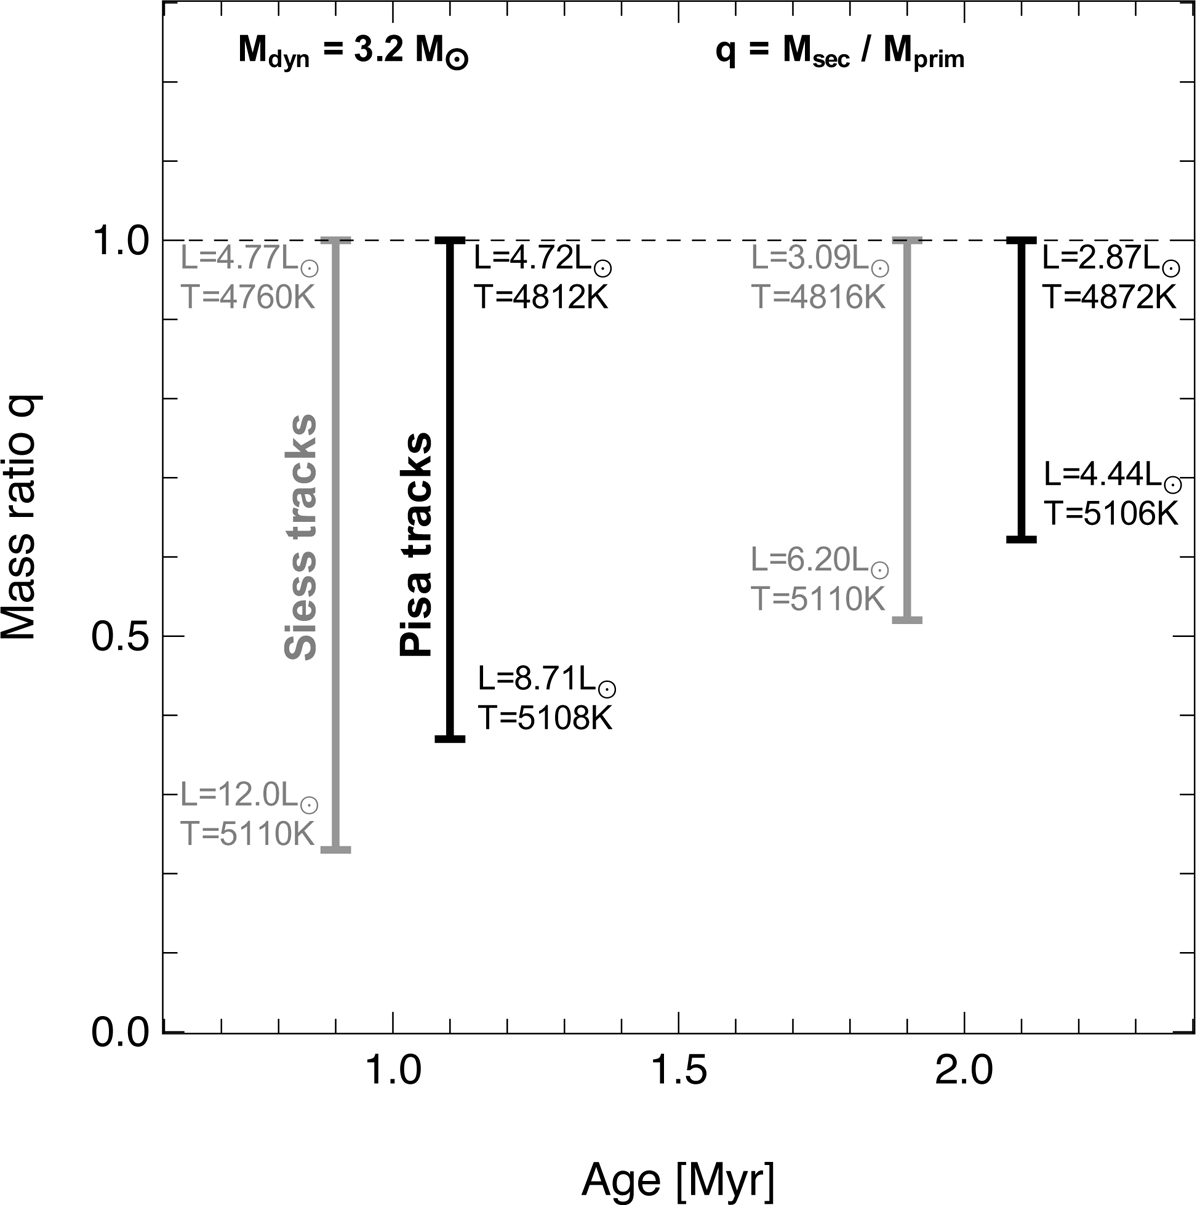
Derivation of the stellar mass ratio in WW Cha via comparison with evolutionary models. The gray curve uses the Siess tracks, and the black curve considers the Pisa tracks. The two median ages considered are 1 and 2 Myr. For each age, two vertical bars are plotted apart for better readability. The derived temperature and luminosity are only reported for the primary component for the two extreme values of the mass ratio.
Current usage metrics show cumulative count of Article Views (full-text article views including HTML views, PDF and ePub downloads, according to the available data) and Abstracts Views on Vision4Press platform.
Data correspond to usage on the plateform after 2015. The current usage metrics is available 48-96 hours after online publication and is updated daily on week days.
Initial download of the metrics may take a while.