Fig. 4.
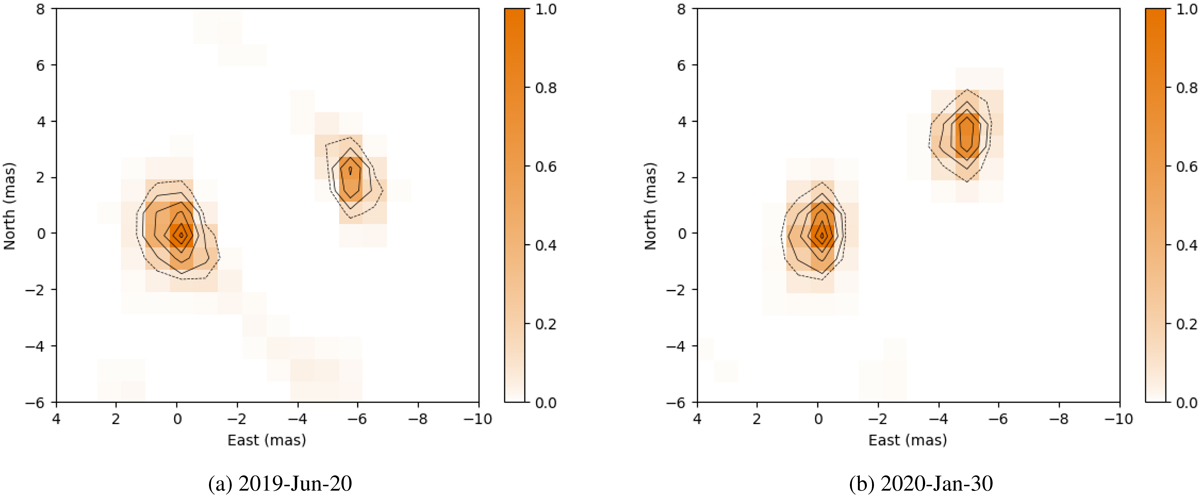
SQUEEZE image reconstruction with a pixel scale of 0.8 mas px−1 for runs G (2019-Jun-20) and I (2020-Jan-30). The solid contours represent the 95%, 80%, 60%, and 20% flux levels. The dashed contour (10% of the maximum flux) represents the 3σ detection limit from the background artifacts. Between both epochs lie 1.08 orbit periods.
Current usage metrics show cumulative count of Article Views (full-text article views including HTML views, PDF and ePub downloads, according to the available data) and Abstracts Views on Vision4Press platform.
Data correspond to usage on the plateform after 2015. The current usage metrics is available 48-96 hours after online publication and is updated daily on week days.
Initial download of the metrics may take a while.