Free Access
Fig. 3.
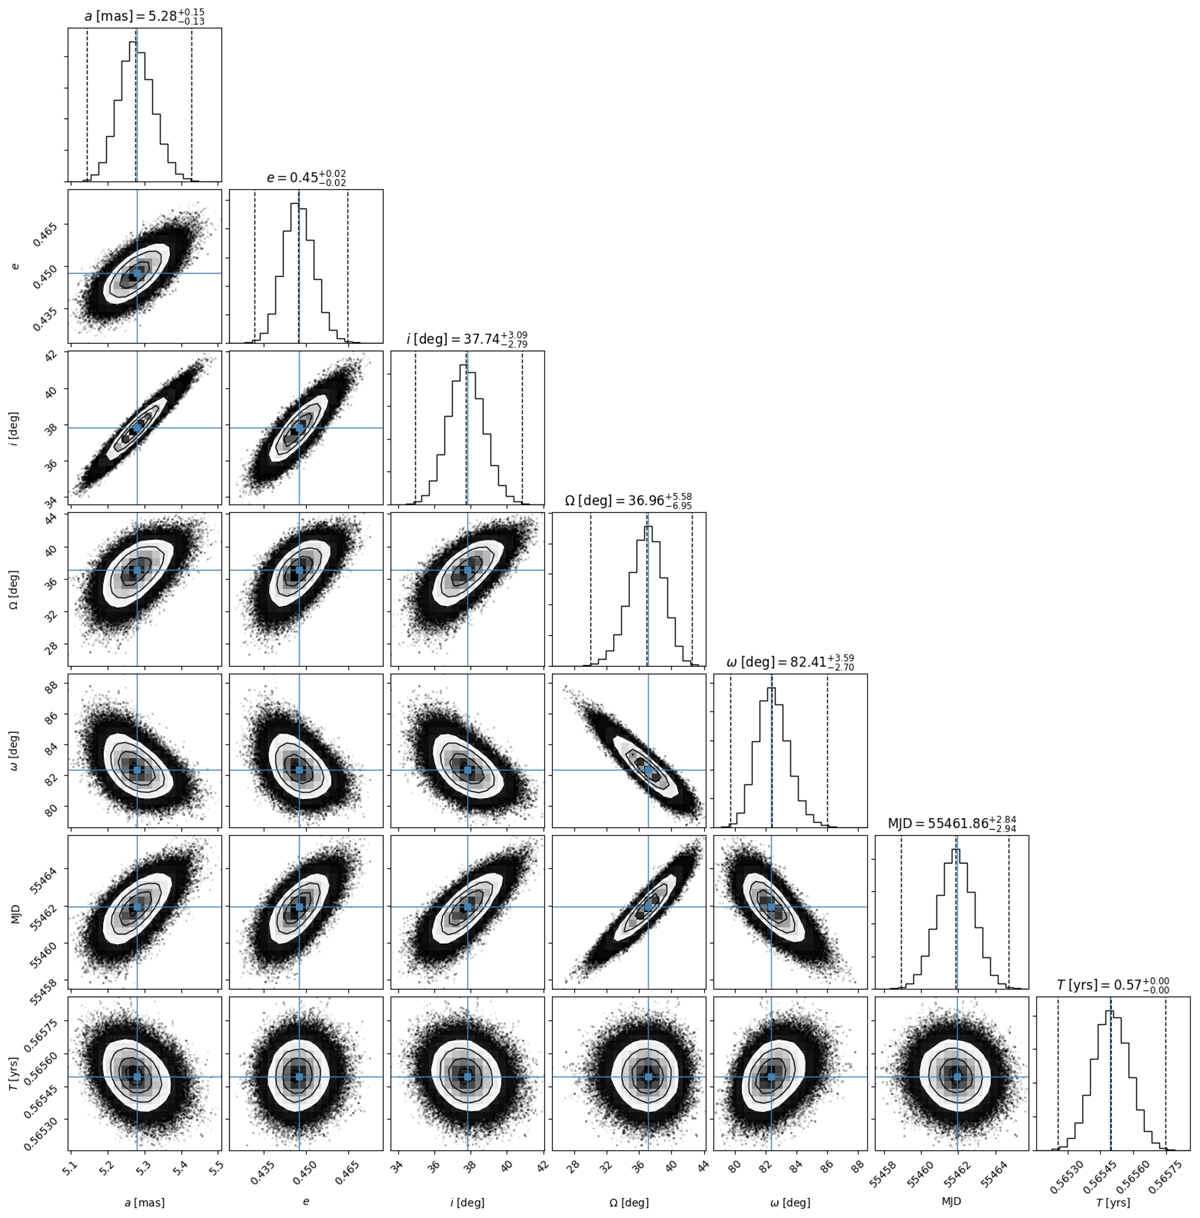
MCMC marginal posterior distributions of the fitted orbital parameters for all nine epochs. The errors are the 3σ confidence intervals. The blue line marks the values of the best fit; the inner dashed line is the median of the distribution, and the outer dashed lines contain the 3σ confidence intervals.
Current usage metrics show cumulative count of Article Views (full-text article views including HTML views, PDF and ePub downloads, according to the available data) and Abstracts Views on Vision4Press platform.
Data correspond to usage on the plateform after 2015. The current usage metrics is available 48-96 hours after online publication and is updated daily on week days.
Initial download of the metrics may take a while.