Fig. 5
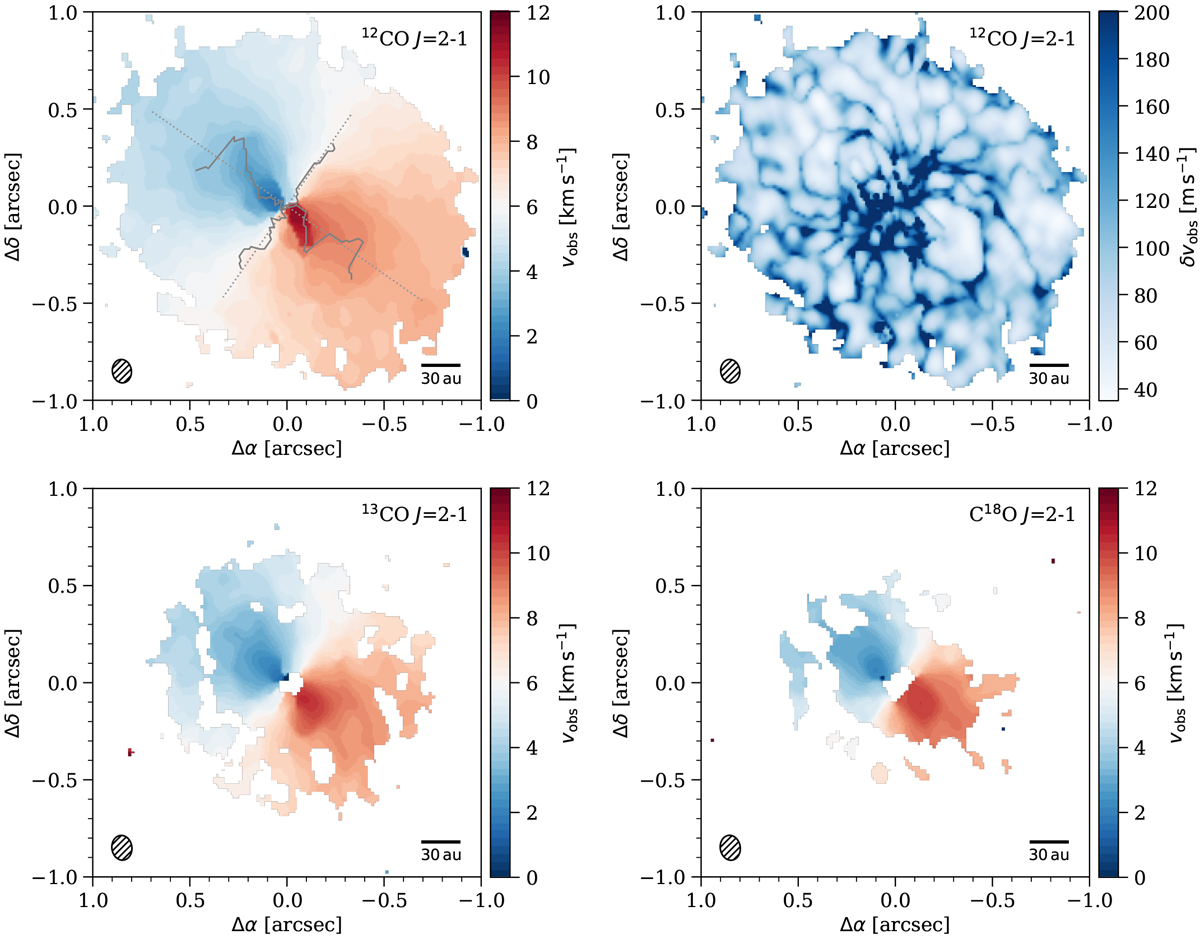
Rotation map of the three CO isotopologues and the corresponding uncertainties of 12 CO (top right panel) calculated with bettermoments. Regions below 4 σ (12 CO) and 3.5 σ (13 CO, C18 O) are masked out. The maximum and minimum velocities along the red- and blueshifted major axes are overlaid with grey lines on the 12CO rotation pattern.
Current usage metrics show cumulative count of Article Views (full-text article views including HTML views, PDF and ePub downloads, according to the available data) and Abstracts Views on Vision4Press platform.
Data correspond to usage on the plateform after 2015. The current usage metrics is available 48-96 hours after online publication and is updated daily on week days.
Initial download of the metrics may take a while.