Fig. 9.
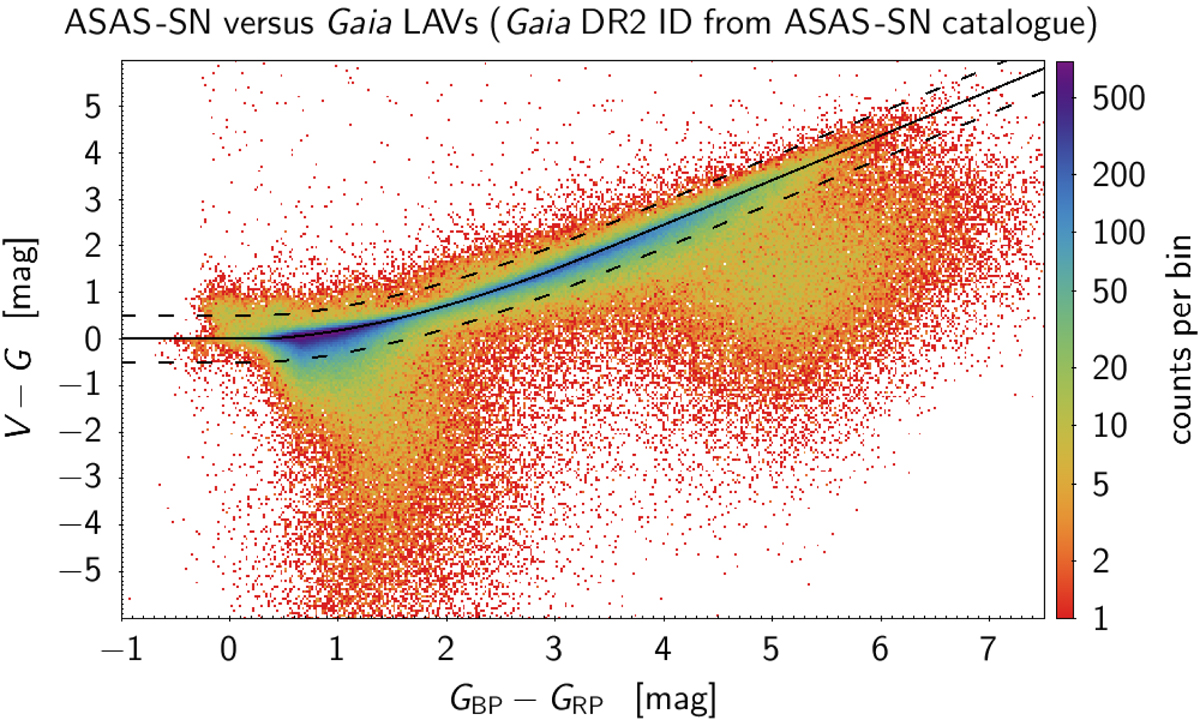
Density map of the difference between mean ASAS-SN V and mean Gaia G magnitudes versus Gaia GBP − GRP colour for all ASAS-SN sources with a Gaia DR2 ID provided in the ASAS-SN catalogue. A random number between −5 and +5 mmag has been added to V to smooth out the two-digit precision magnitude published in the ASAS-SN catalogue. This is not necessary for the Gaia magnitudes, which are reported with four digits in that catalogue. The solid line represents Eq. (7) as a function of GBP − GRP, and the two dashed lines represent deviations of 0.5 mag above and below this function. The axis ranges have been limited for better visibility.
Current usage metrics show cumulative count of Article Views (full-text article views including HTML views, PDF and ePub downloads, according to the available data) and Abstracts Views on Vision4Press platform.
Data correspond to usage on the plateform after 2015. The current usage metrics is available 48-96 hours after online publication and is updated daily on week days.
Initial download of the metrics may take a while.