Fig. 6.
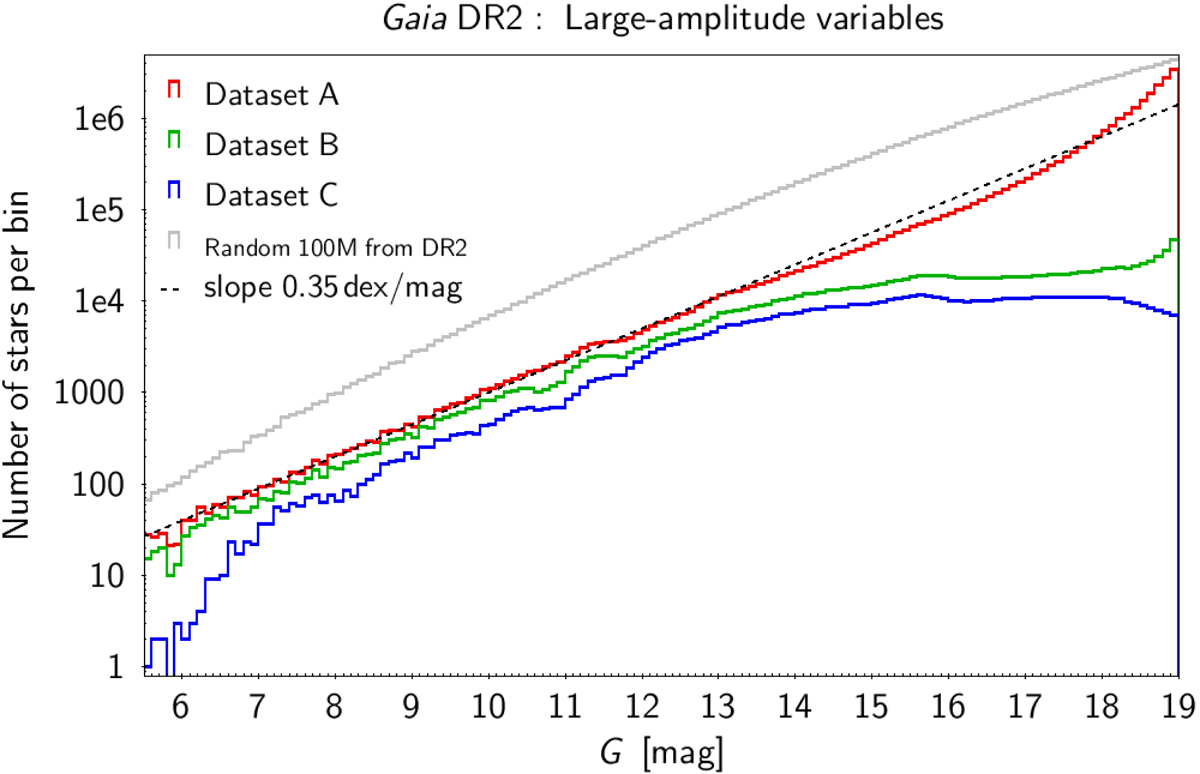
G magnitude histograms for, from top to bottom lines, a sample of 100 million sources randomly taken from Gaia DR2 (in grey), Dataset A (in red), Dataset B (in green), and Dataset C (in blue). Bins are 0.1 mag wide. On the log scale of the ordinate, a dotted straight line with slope 0.35 dex mag−1 is adjusted to the histogram of Dataset A.
Current usage metrics show cumulative count of Article Views (full-text article views including HTML views, PDF and ePub downloads, according to the available data) and Abstracts Views on Vision4Press platform.
Data correspond to usage on the plateform after 2015. The current usage metrics is available 48-96 hours after online publication and is updated daily on week days.
Initial download of the metrics may take a while.