Free Access
Fig. C.4.
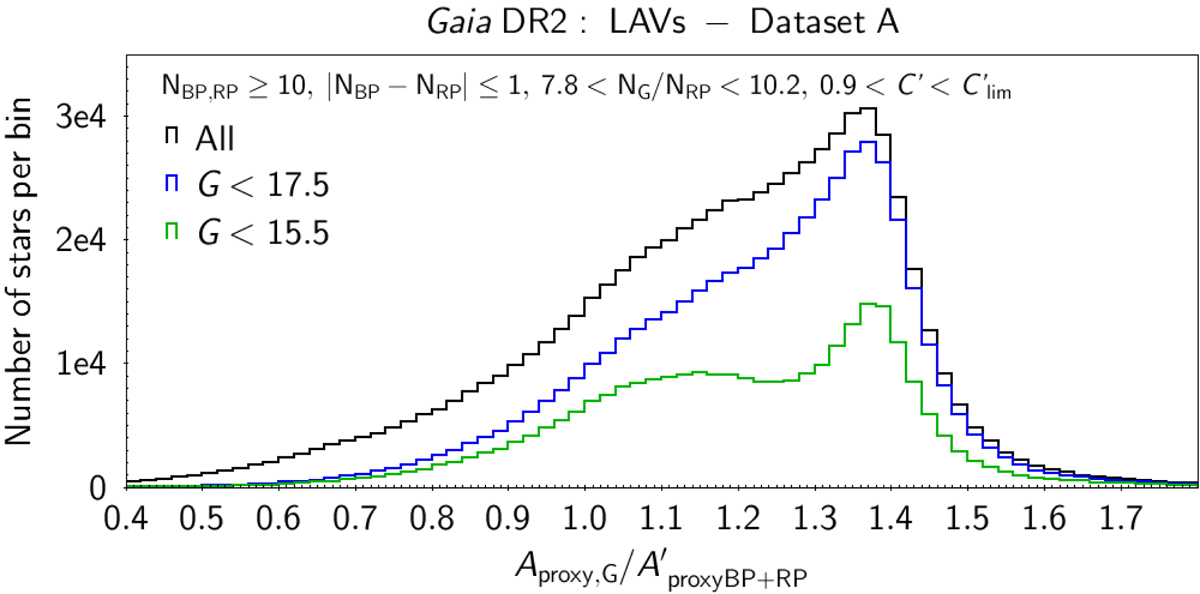
Histogram (in black) of ![]() for the sample of Dataset A with NBP, RP ≥ 10, |NBP − NRP| ≤ 1, 7.8 < Nobs(G)/Nobs(RP) < 10.2, and
for the sample of Dataset A with NBP, RP ≥ 10, |NBP − NRP| ≤ 1, 7.8 < Nobs(G)/Nobs(RP) < 10.2, and ![]() . The blue and green histograms are for the subsets therein with G < 17.5 mag and G < 15.5 mag, respectively. The abscissa range has been limited for better visibility.
. The blue and green histograms are for the subsets therein with G < 17.5 mag and G < 15.5 mag, respectively. The abscissa range has been limited for better visibility.
Current usage metrics show cumulative count of Article Views (full-text article views including HTML views, PDF and ePub downloads, according to the available data) and Abstracts Views on Vision4Press platform.
Data correspond to usage on the plateform after 2015. The current usage metrics is available 48-96 hours after online publication and is updated daily on week days.
Initial download of the metrics may take a while.