Fig. 5.
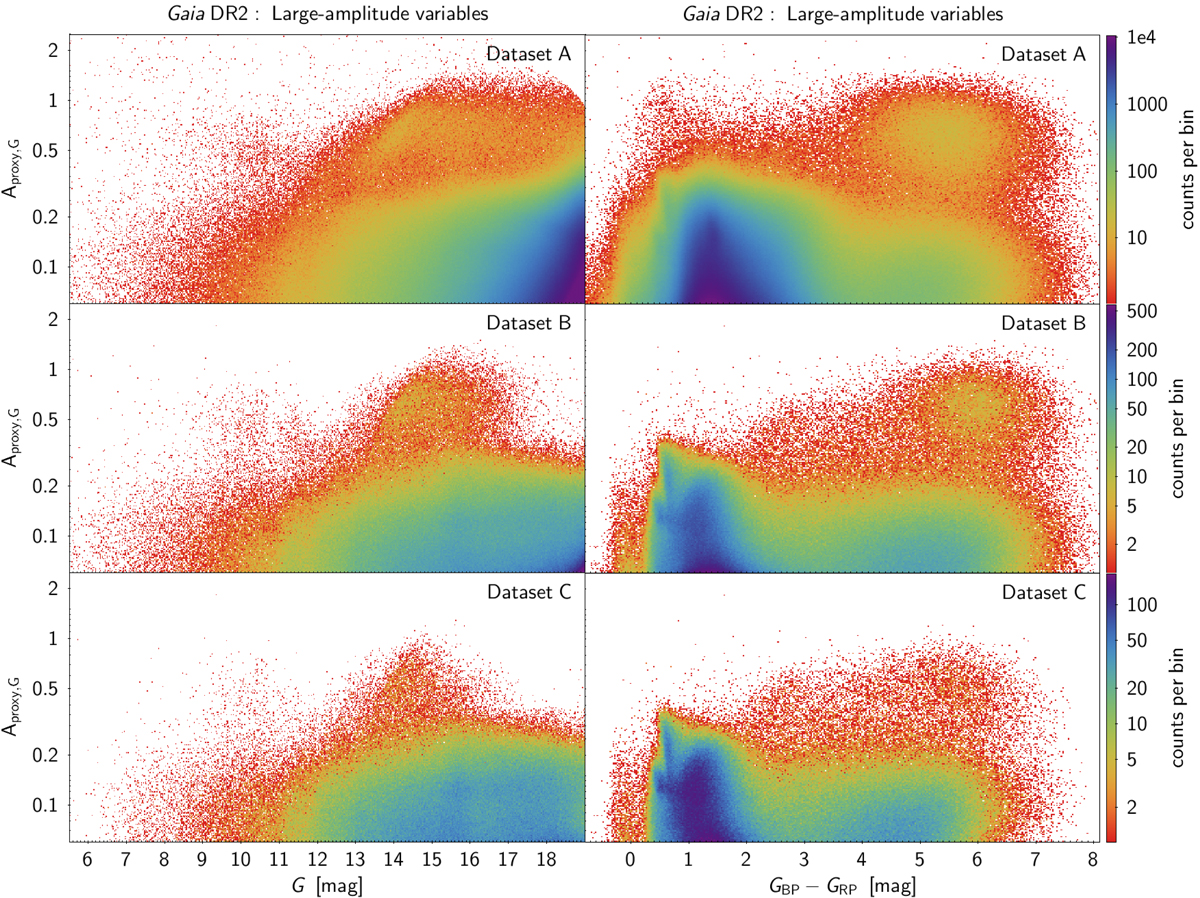
Density maps of the G amplitude proxy versus G magnitude (left panels) and versus GBP − GRP colour (right panels) for Datasets A (top panels) B (middle panels) and C (bottom panels). The colours of each grid cell in the maps are related to the logarithm of the density of points in the cells according to the colour scale shown on the right of each row of panels. The two panels in a given row share the same density colour scale. We note that the top-right panel of Dataset A should be analysed with caution, as it contains sources with unreliable GBP and/or GRP.
Current usage metrics show cumulative count of Article Views (full-text article views including HTML views, PDF and ePub downloads, according to the available data) and Abstracts Views on Vision4Press platform.
Data correspond to usage on the plateform after 2015. The current usage metrics is available 48-96 hours after online publication and is updated daily on week days.
Initial download of the metrics may take a while.