Fig. C.2.
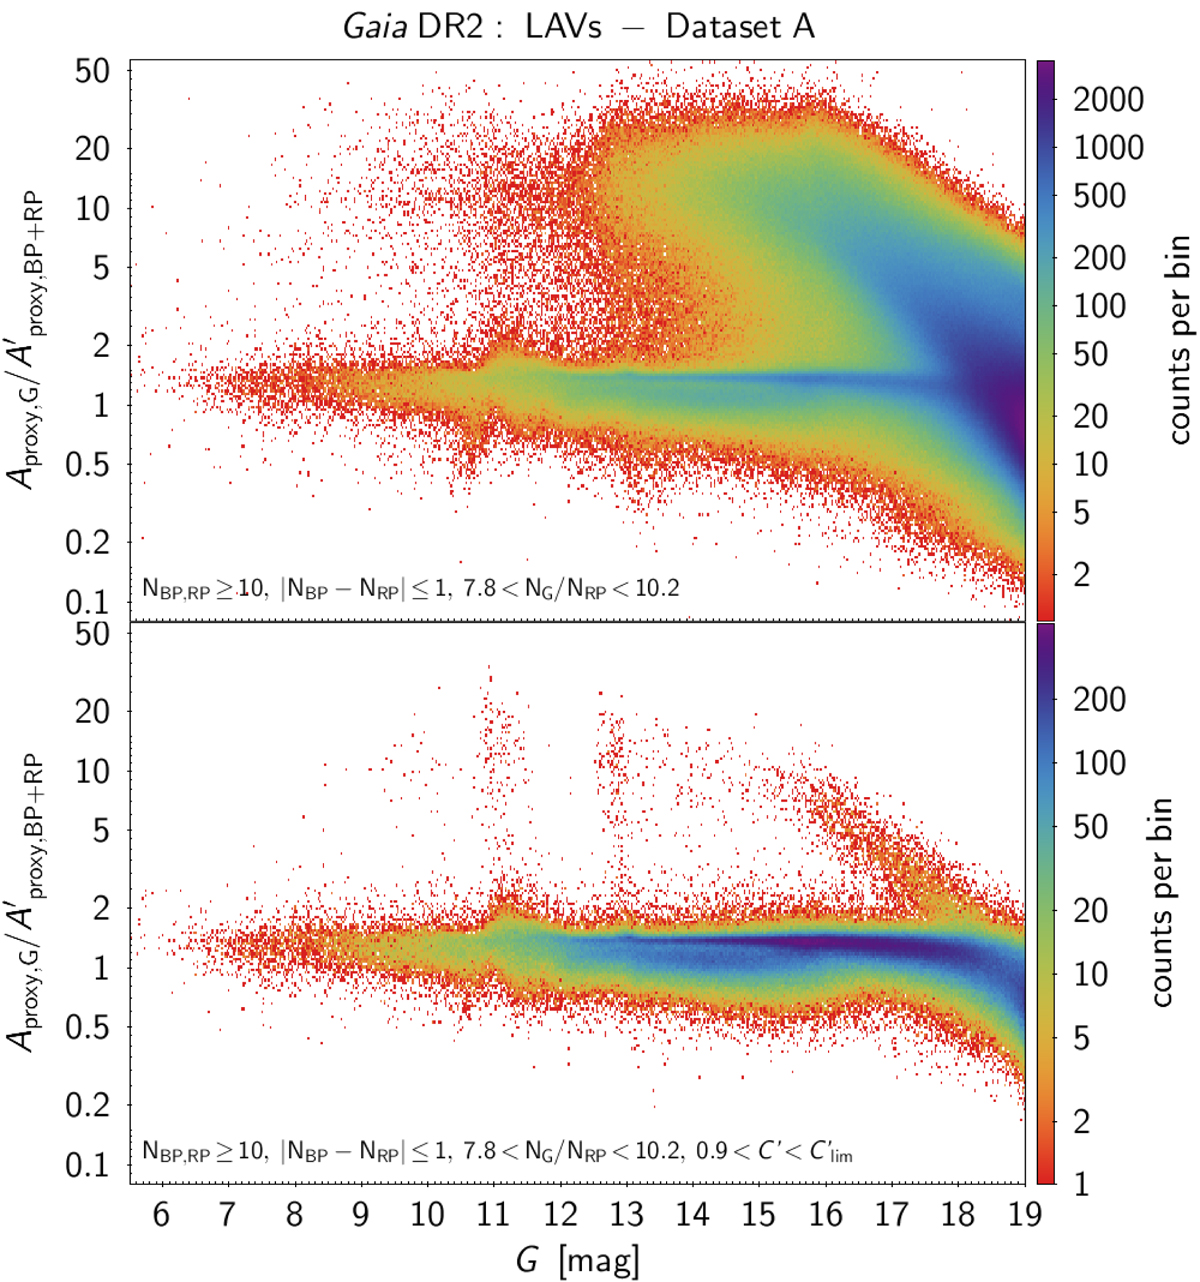
Density maps of the ratio between the variability proxy in fG (Eq. (2)) and the variability proxy in fBP + fRP neglecting the covariance between fBP and fRP (Eq. (C.10)), versus mean G magnitude. Top panel: map for all sources in Dataset A while bottom panel: map for the sub-sample of Dataset A that has reliable BP and RP flux excess according to Eq. (B.4). The ordinate ranges are identical in both panels and have been limited for better visibility.
Current usage metrics show cumulative count of Article Views (full-text article views including HTML views, PDF and ePub downloads, according to the available data) and Abstracts Views on Vision4Press platform.
Data correspond to usage on the plateform after 2015. The current usage metrics is available 48-96 hours after online publication and is updated daily on week days.
Initial download of the metrics may take a while.