Fig. B.11.
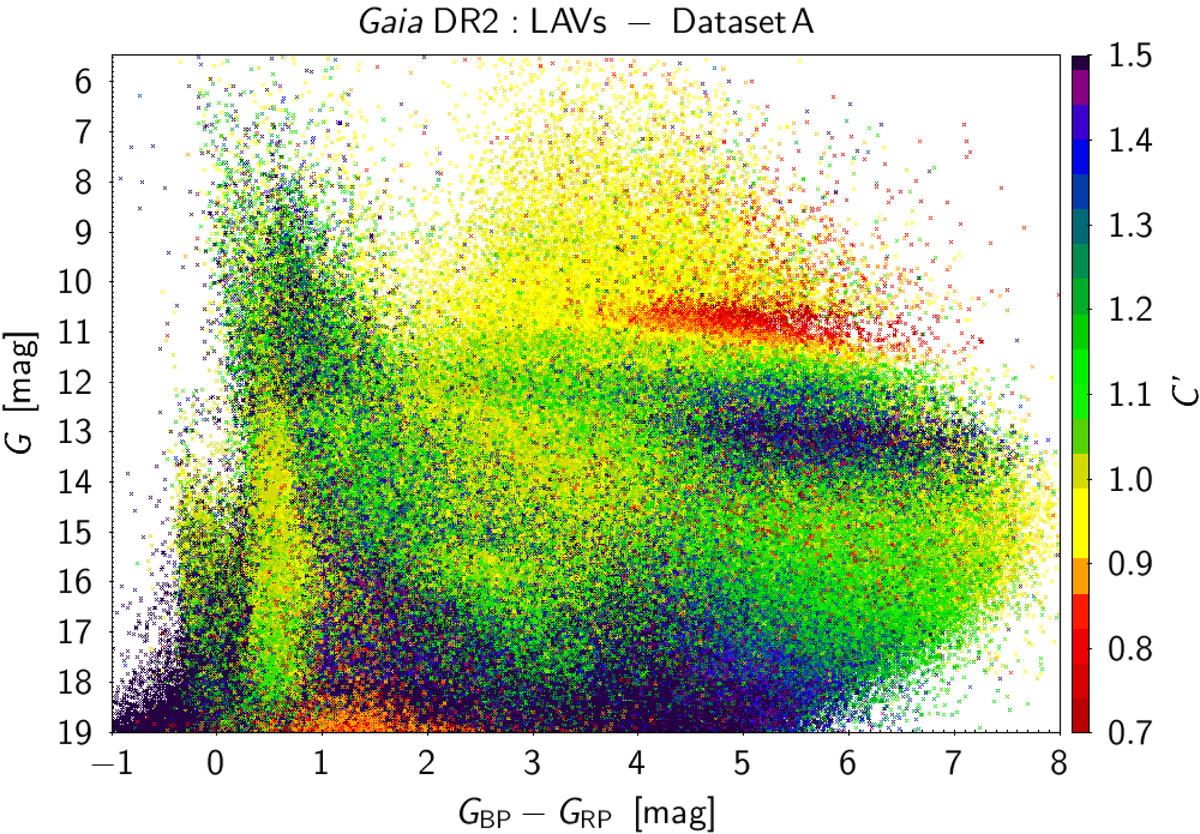
Colour-magnitude diagram of Dataset A with the normalized BP and RP flux excess colour-coded according to the colour scale shown on the right of the figure. The colour scale has been limited between 0.7 and 1.5, sources with C′ values outside this range being rendered in the colour at the respective end of the scale. Sources with C′ < 0.9 have been plotted on top of other sources for better visibility as they contain a very small number of sources compared to the size of Dataset A.
Current usage metrics show cumulative count of Article Views (full-text article views including HTML views, PDF and ePub downloads, according to the available data) and Abstracts Views on Vision4Press platform.
Data correspond to usage on the plateform after 2015. The current usage metrics is available 48-96 hours after online publication and is updated daily on week days.
Initial download of the metrics may take a while.