Fig. B.9.
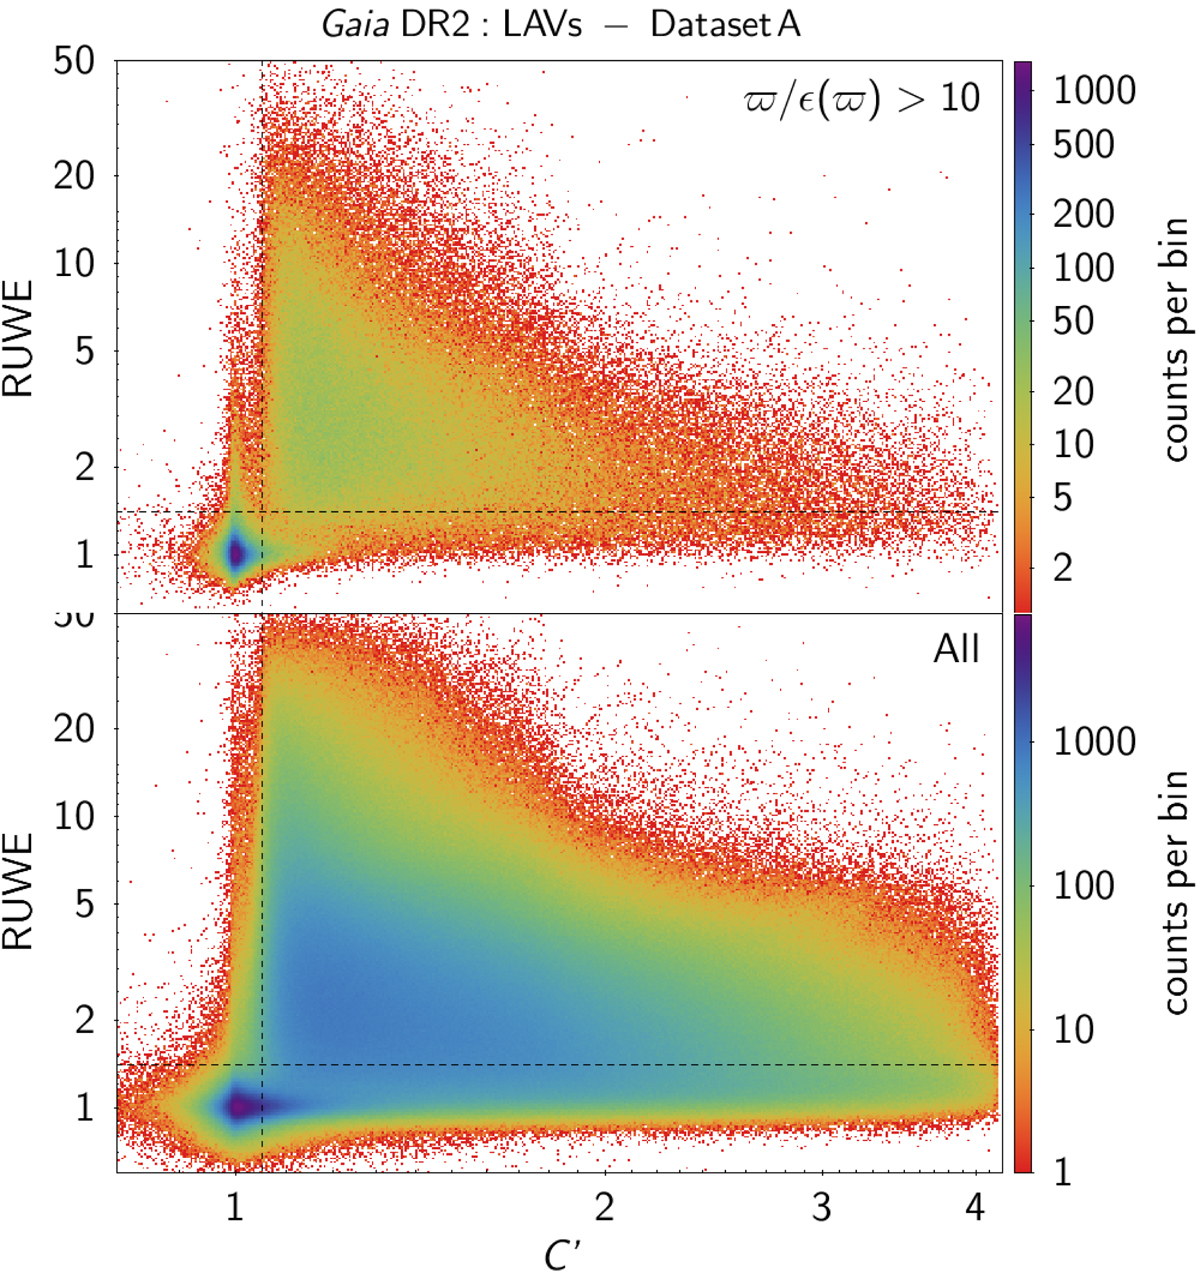
Density map of the Renormalized Unit Weight Excess versus normalized BP and RP flux excess for sources in Dataset A that have parallax uncertainties better than 10% (top panel). The same figure, but for all sources in Dataset A, is shown in the bottom panel. Vertical and horizontal dotted lines have been drawn at C′ = 1.04 and RUWE = 1.4, respectively, as eye guides. The axes ranges have been limited for better visibility.
Current usage metrics show cumulative count of Article Views (full-text article views including HTML views, PDF and ePub downloads, according to the available data) and Abstracts Views on Vision4Press platform.
Data correspond to usage on the plateform after 2015. The current usage metrics is available 48-96 hours after online publication and is updated daily on week days.
Initial download of the metrics may take a while.