Fig. B.5.
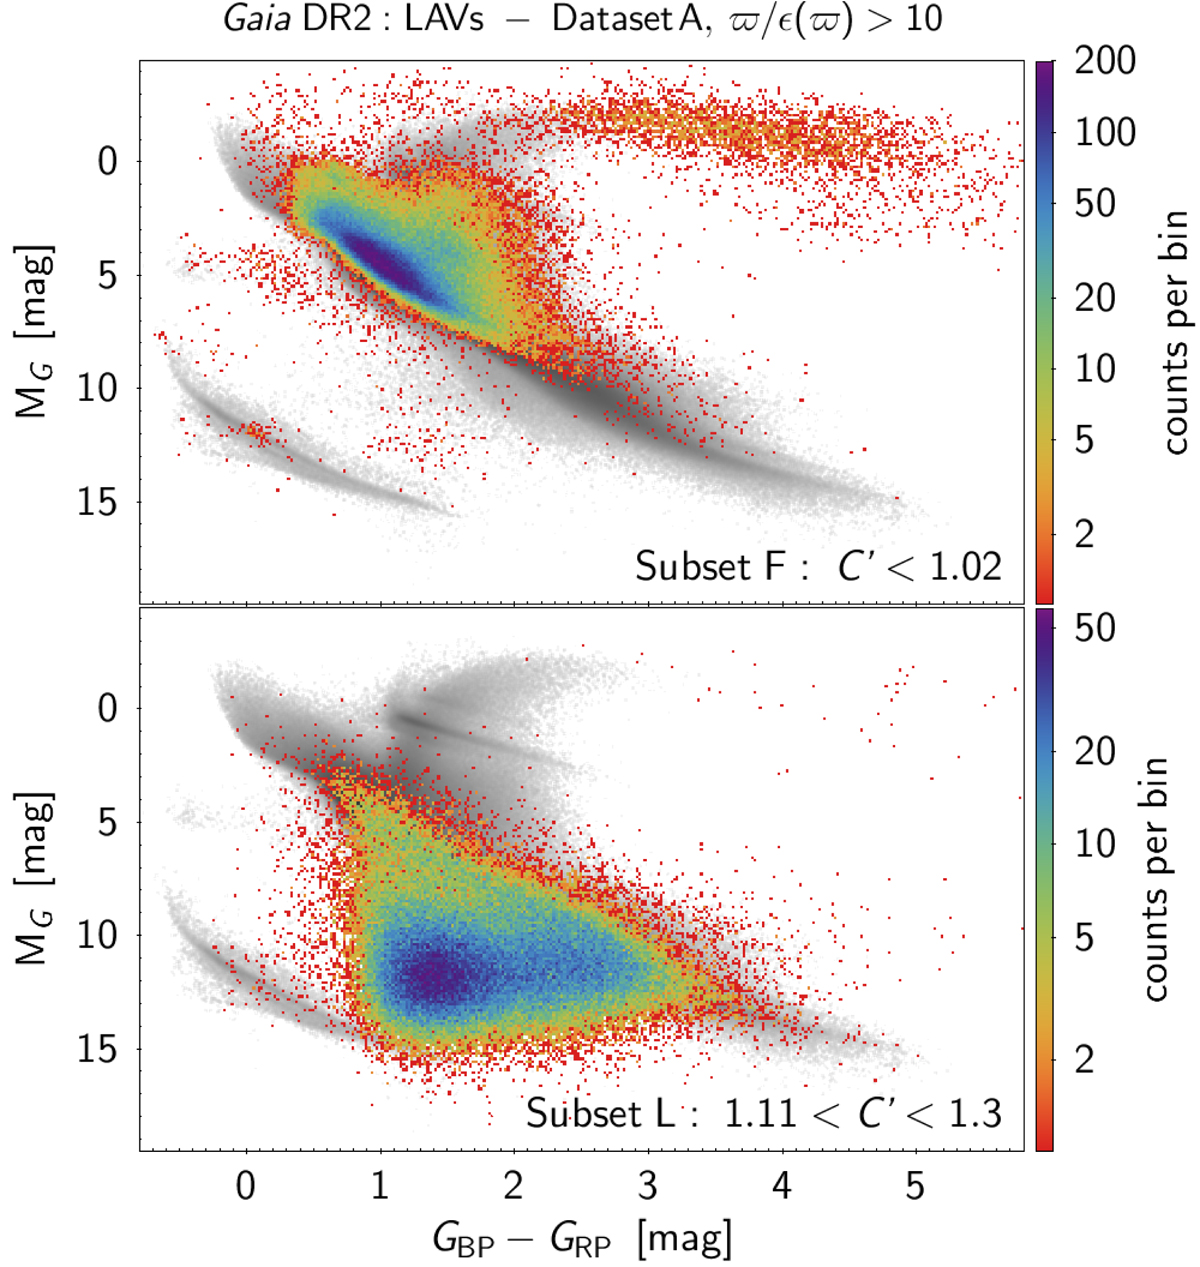
Density maps of the observational HRDs of two dataset A sub-samples with relative parallax uncertainties better than 10%: for sources with C′ < 1.02 in the top panel (subset F in the text) and for sources with 1.11 < C′ < 1.3 in the bottom panel (subset L in the text). The density maps are plotted on top of Gaia DR2 sources (constant and variable) with relative parallax uncertainties better than 2.5% (light grey in the background). Density goes from low in red to high in black on a logarithmic scale.
Current usage metrics show cumulative count of Article Views (full-text article views including HTML views, PDF and ePub downloads, according to the available data) and Abstracts Views on Vision4Press platform.
Data correspond to usage on the plateform after 2015. The current usage metrics is available 48-96 hours after online publication and is updated daily on week days.
Initial download of the metrics may take a while.