Free Access
Fig. 4.
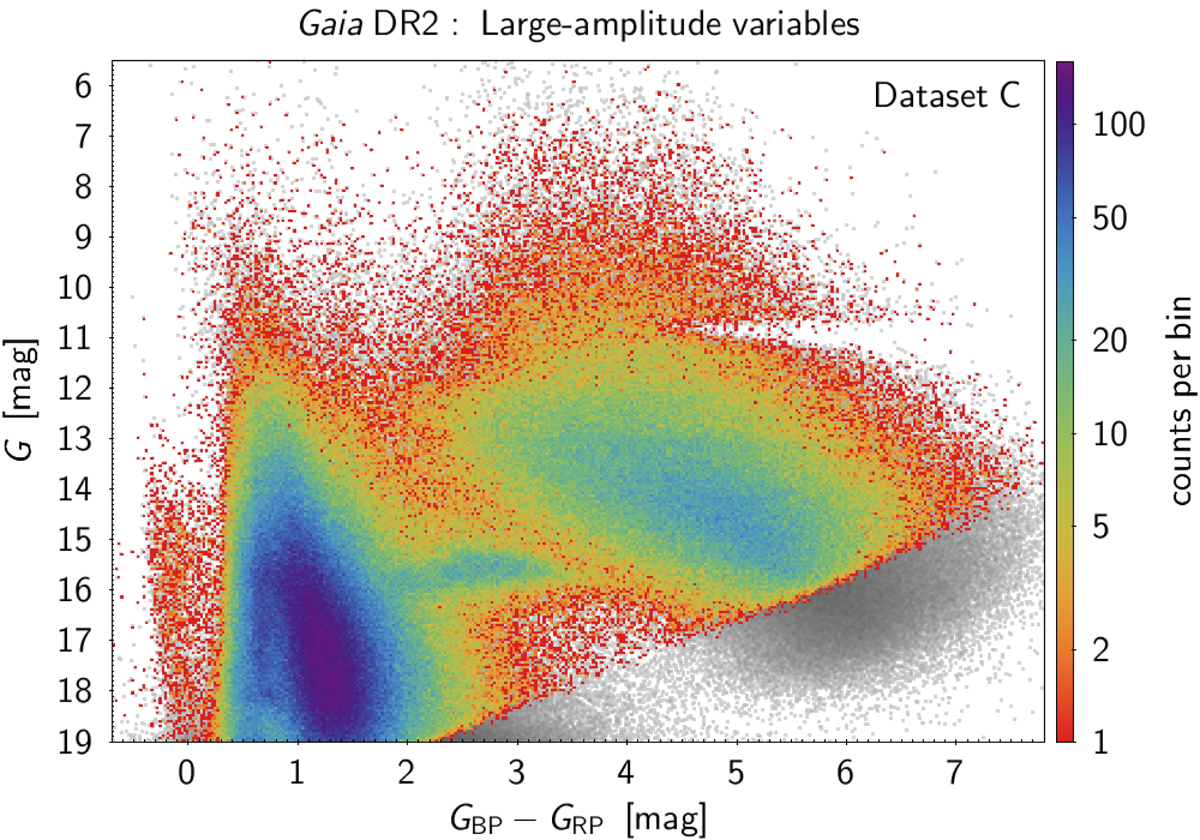
Density map of the colour-magnitude diagram of Dataset C. Dataset B is plotted in grey in the background. The axes range have been limited for better visibility. The lack of very red sources at G ≃ 11 mag in Datasets B and C is due to limitations in the DR2 processing leading to too low BP and RP flux excesses (see text).
Current usage metrics show cumulative count of Article Views (full-text article views including HTML views, PDF and ePub downloads, according to the available data) and Abstracts Views on Vision4Press platform.
Data correspond to usage on the plateform after 2015. The current usage metrics is available 48-96 hours after online publication and is updated daily on week days.
Initial download of the metrics may take a while.