Free Access
Fig. B.4.
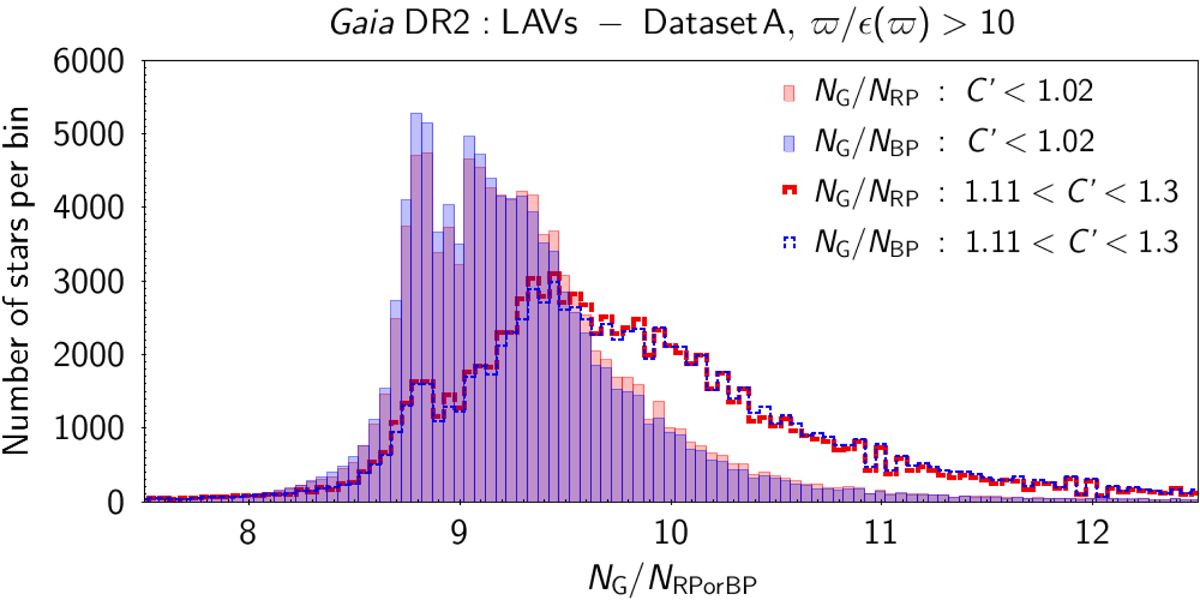
Same as Fig. A.6, but for the subsets of Dataset A that have parallax relative uncertainties better than 10% and either C′ < 1.02 (filled histograms) or 1.11 < C′ < 1.3 (dashed lines). Histograms of GBP are shown in blue and those of GRP are shown in red. Bins are 0.05 wide.
Current usage metrics show cumulative count of Article Views (full-text article views including HTML views, PDF and ePub downloads, according to the available data) and Abstracts Views on Vision4Press platform.
Data correspond to usage on the plateform after 2015. The current usage metrics is available 48-96 hours after online publication and is updated daily on week days.
Initial download of the metrics may take a while.