Fig. B.2.
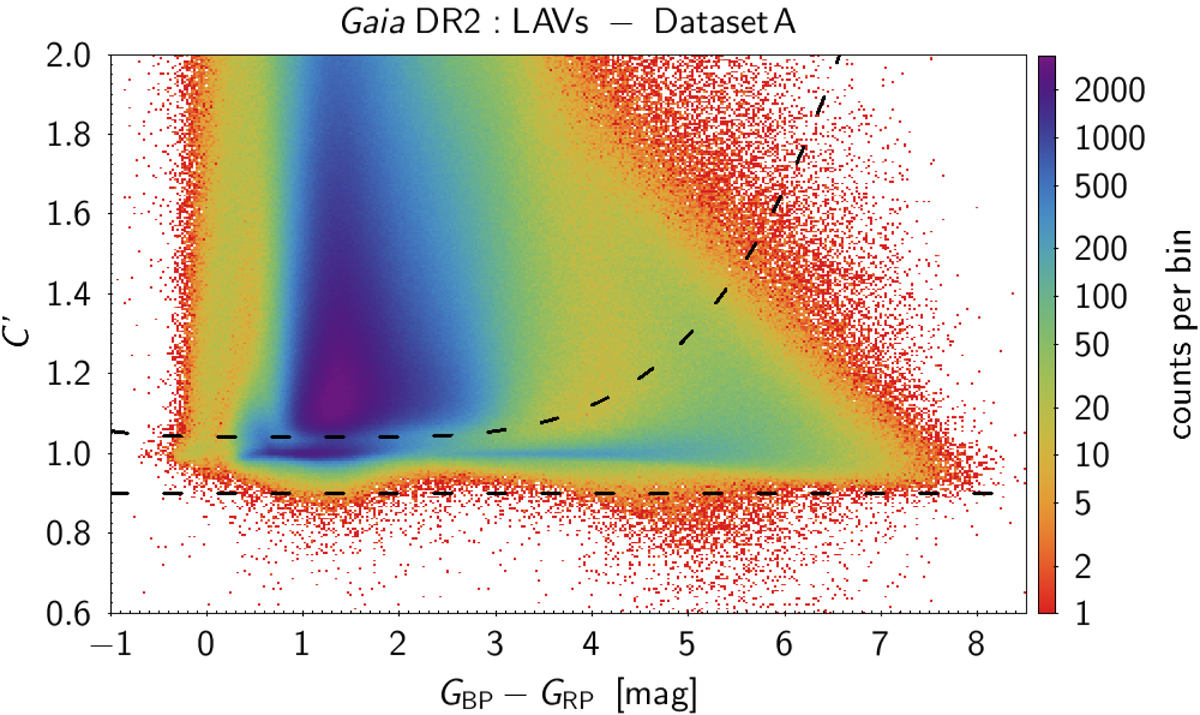
Same as Fig. B.1, but for the normalized BP and RP flux excess C′ defined by Eq. (B.3). The upper dashed line is the function 1.04 + 0.001 (GBP − GRP − 1)3 above which GBP and/or GRP should not be reliable (see text). The lower dashed line is the lower limit at C′ = 0.9. The ordinate is zoomed compared to Fig. B.1 for better visibility.
Current usage metrics show cumulative count of Article Views (full-text article views including HTML views, PDF and ePub downloads, according to the available data) and Abstracts Views on Vision4Press platform.
Data correspond to usage on the plateform after 2015. The current usage metrics is available 48-96 hours after online publication and is updated daily on week days.
Initial download of the metrics may take a while.