Fig. B.1.
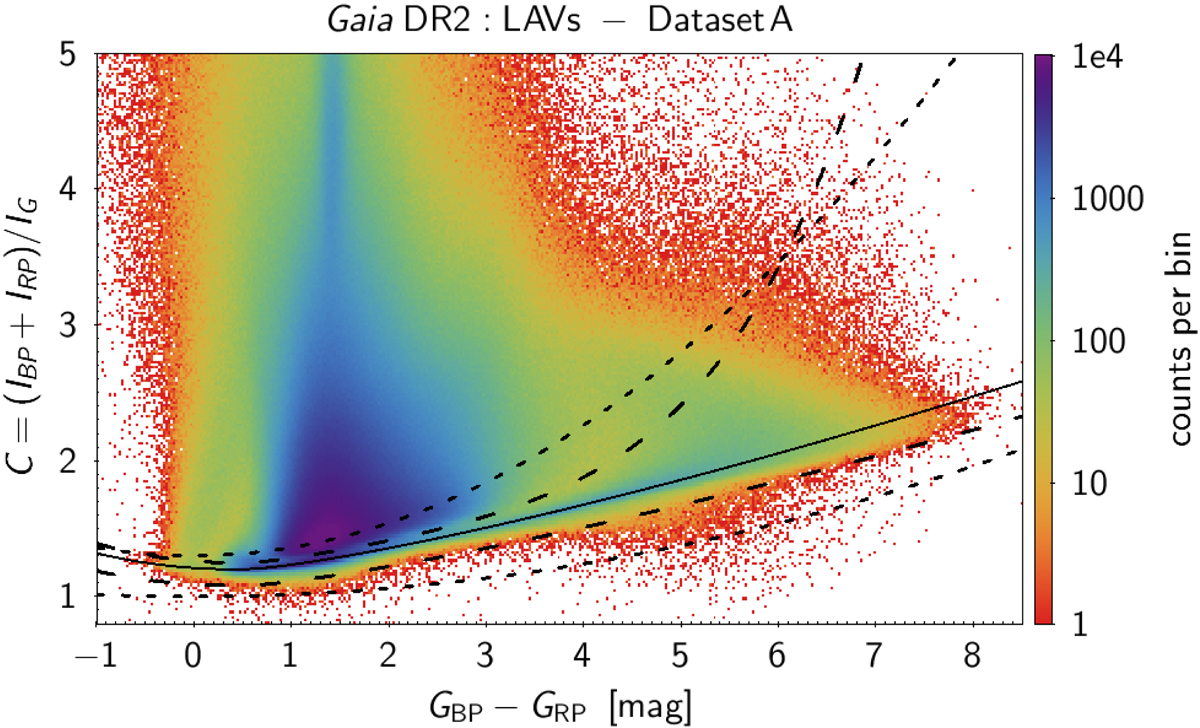
Density map of the BP and RP flux excess C (Eq. (B.1)) versus GBP − GRP colour for all sources in Dataset A. The solid line is the function given by Eq. (B.2), while the long-dashed thick lines are the limits given by Eq. (B.4) outside of which GBP and/or GRP are considered to be unreliable relative to G. For information, the limits proposed by Arenou et al. (2018) are shown in short-dashed lines.
Current usage metrics show cumulative count of Article Views (full-text article views including HTML views, PDF and ePub downloads, according to the available data) and Abstracts Views on Vision4Press platform.
Data correspond to usage on the plateform after 2015. The current usage metrics is available 48-96 hours after online publication and is updated daily on week days.
Initial download of the metrics may take a while.