Fig. A.9.
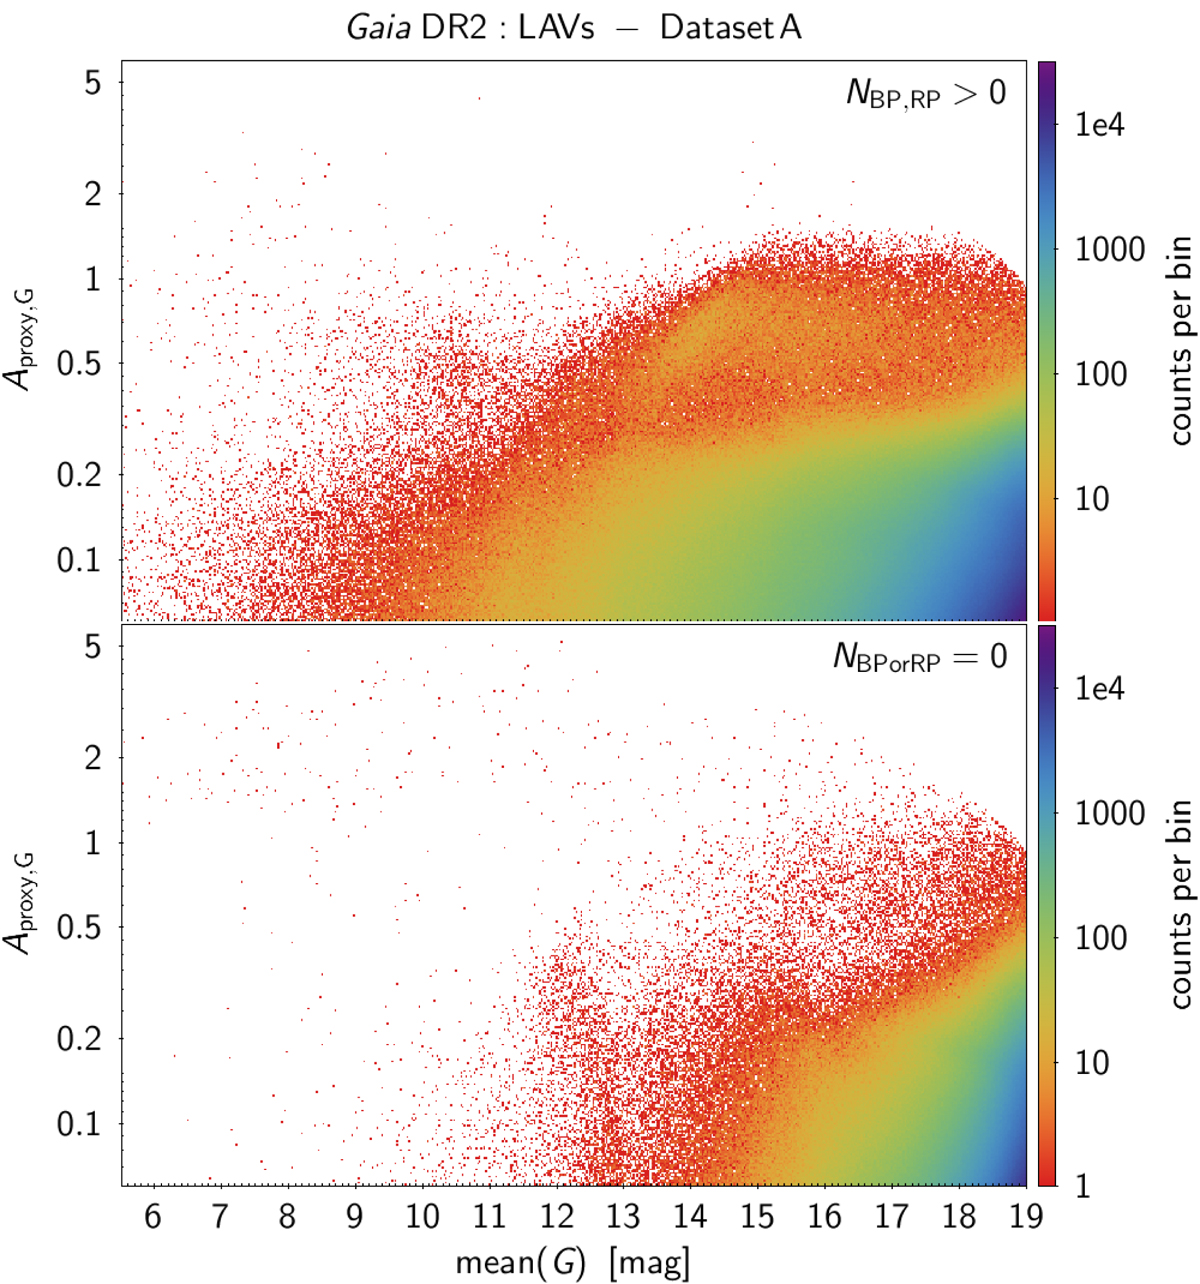
Density maps of the amplitude proxy Aproxy,G versus mean G magnitude of LAV candidates in Dataset A with non-empty GBP and GRP time series (upper panel), or having at least one of the two time series empty (lower panel). Both panels have the same colour range, shown on the right of the each panel, giving the number of counts per bin.
Current usage metrics show cumulative count of Article Views (full-text article views including HTML views, PDF and ePub downloads, according to the available data) and Abstracts Views on Vision4Press platform.
Data correspond to usage on the plateform after 2015. The current usage metrics is available 48-96 hours after online publication and is updated daily on week days.
Initial download of the metrics may take a while.