Free Access
Fig. A.3.
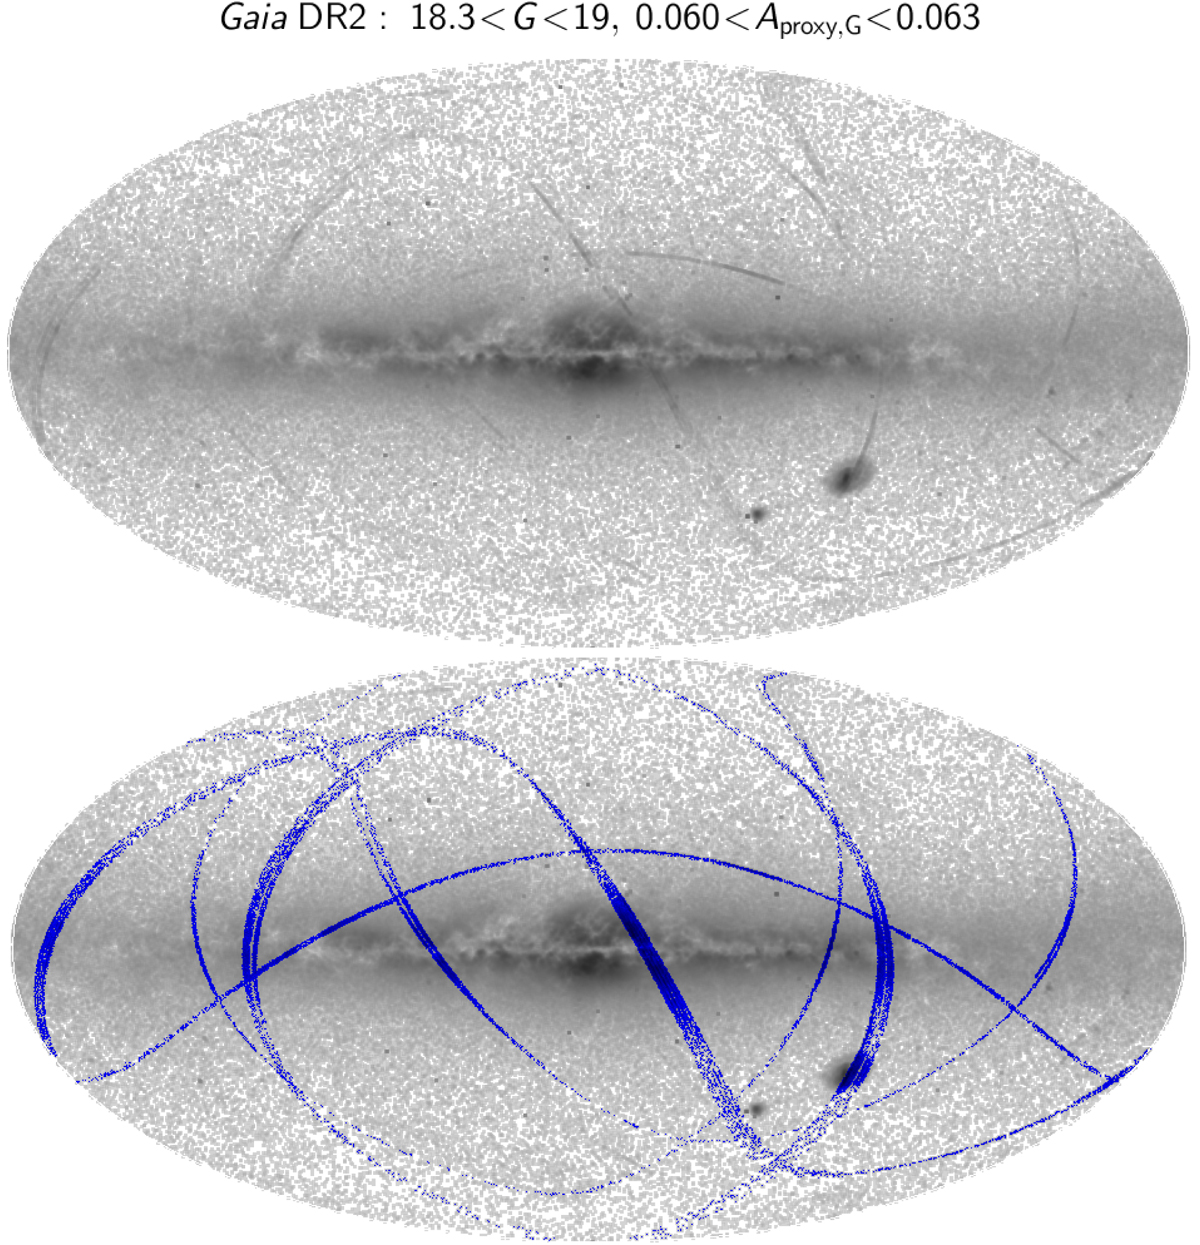
Same as Fig. A.2, but limited to the sub-sample with 0.06 < Aproxy, G < 0.063 and 18.3 < G/mag < 19. The time-interval-limited stripes identified with the Gaia nominal scanning law as containing bad measurements are shown in blue in the bottom panel.
Current usage metrics show cumulative count of Article Views (full-text article views including HTML views, PDF and ePub downloads, according to the available data) and Abstracts Views on Vision4Press platform.
Data correspond to usage on the plateform after 2015. The current usage metrics is available 48-96 hours after online publication and is updated daily on week days.
Initial download of the metrics may take a while.