Fig. A.1.
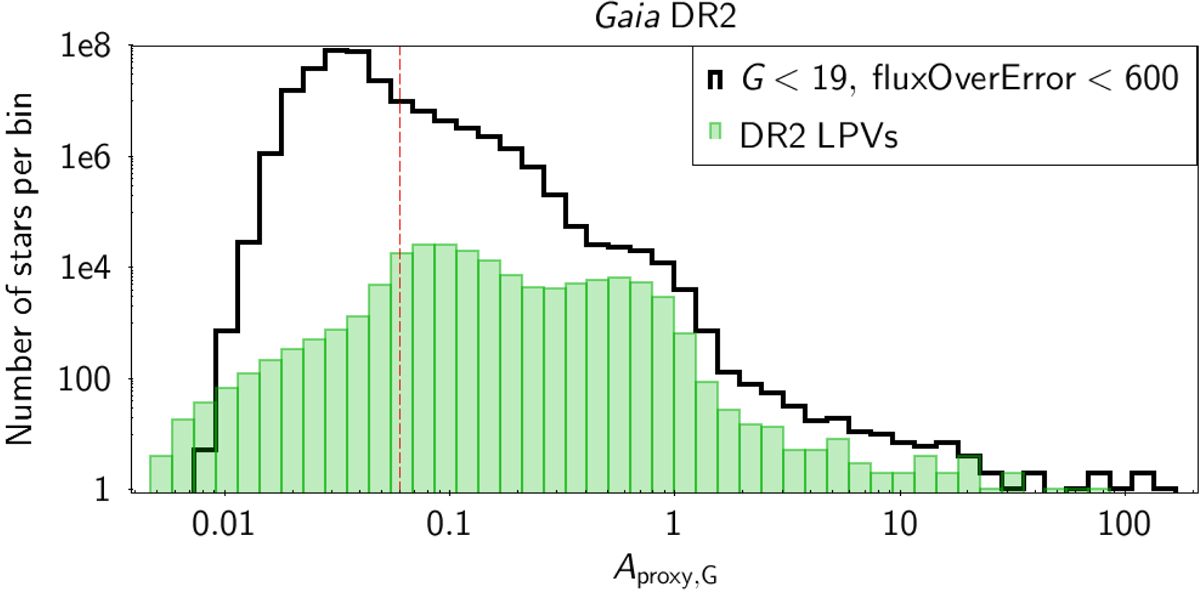
Distributions of the variability amplitude proxy of sources in the Gaia DR2 archive. The black histogram represents all sources brighter than G = 19 mag with mean G flux over error ratios IG/ε(IG) < 600. The filled green histogram represents the sources published in the specific DR2 catalogue of LPVs. The vertical red dashed line locates the Aproxy, G = 0.06 limit used to select large-amplitude variable candidates in this study.
Current usage metrics show cumulative count of Article Views (full-text article views including HTML views, PDF and ePub downloads, according to the available data) and Abstracts Views on Vision4Press platform.
Data correspond to usage on the plateform after 2015. The current usage metrics is available 48-96 hours after online publication and is updated daily on week days.
Initial download of the metrics may take a while.