Free Access
Fig. 26.
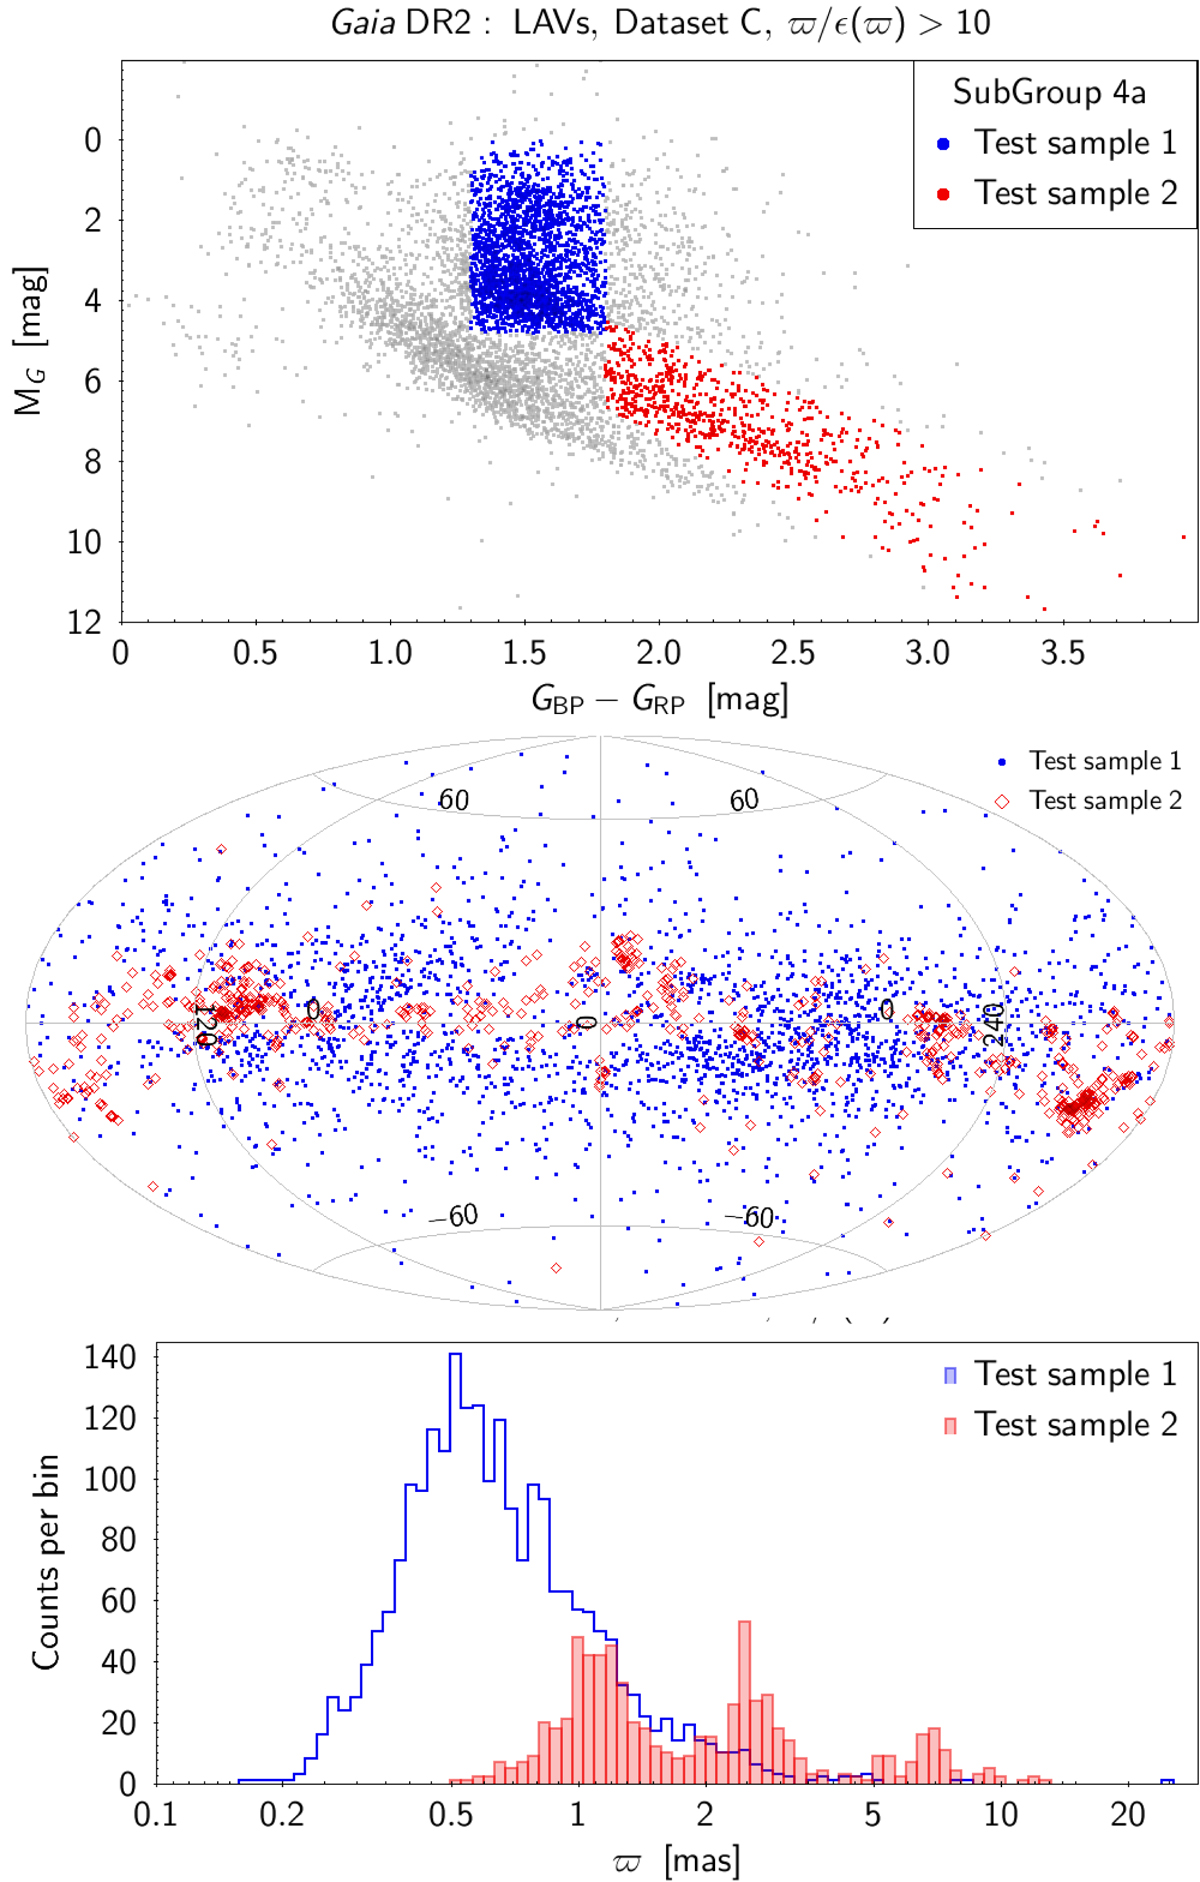
Properties of two Subgroup 4a samples selected from their locations in the observational HRD as shown by the blue and red samples in the top panel. Their sky distributions are shown in the middle panel, and the histograms of their parallaxes are shown in the bottom panel.
Current usage metrics show cumulative count of Article Views (full-text article views including HTML views, PDF and ePub downloads, according to the available data) and Abstracts Views on Vision4Press platform.
Data correspond to usage on the plateform after 2015. The current usage metrics is available 48-96 hours after online publication and is updated daily on week days.
Initial download of the metrics may take a while.