Fig. 24.
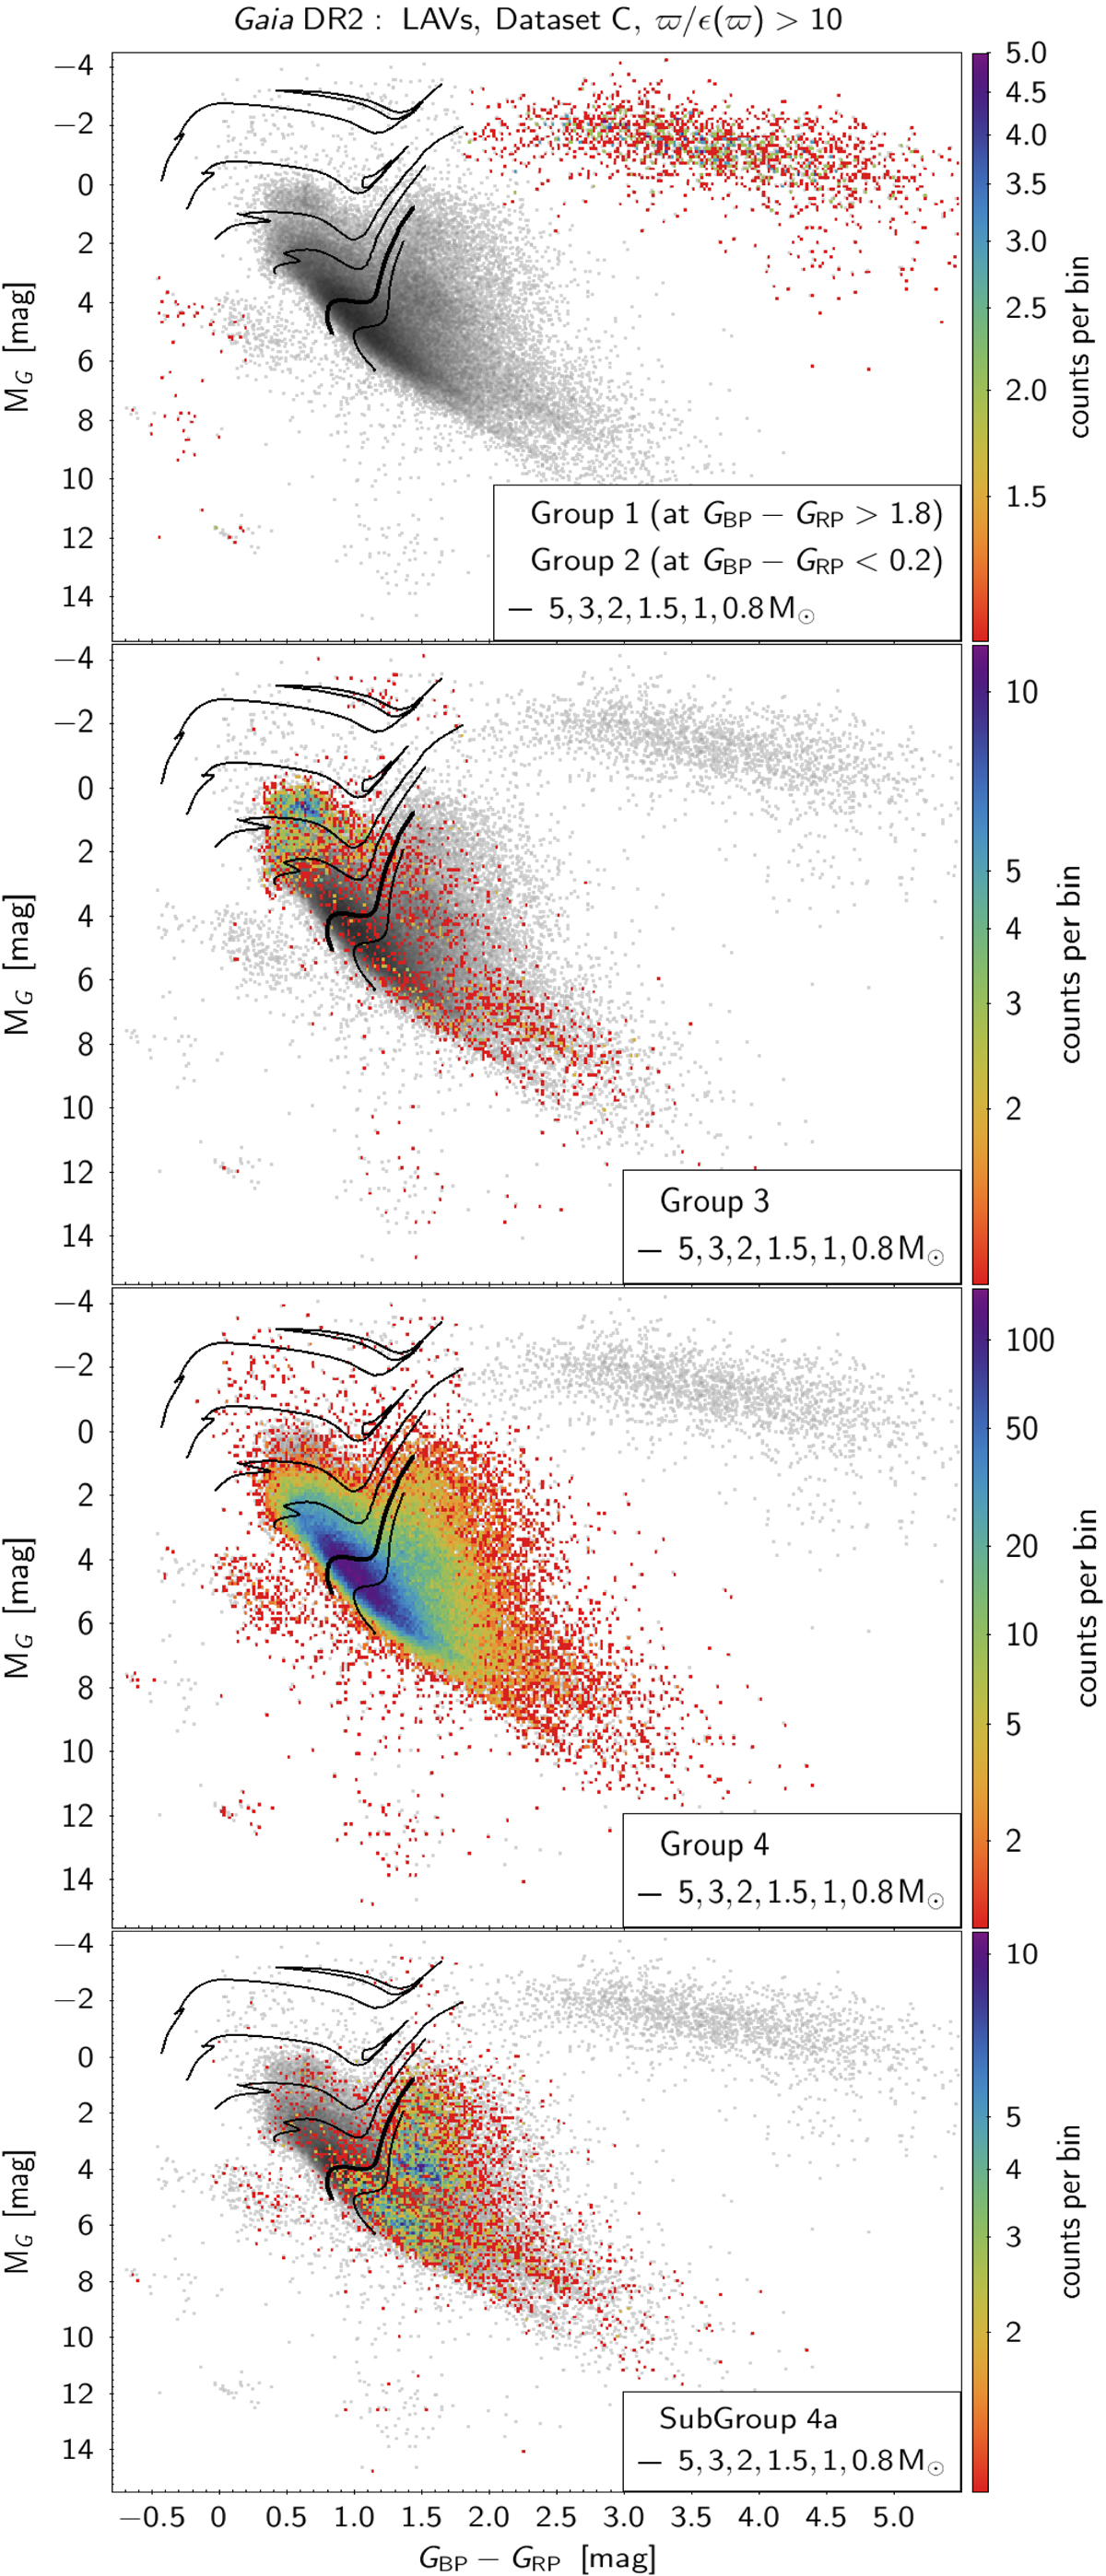
Density maps of observational HRDs of Group 1 (top panel, sources having GBP − GRP > 1.8 mag), Group 2 (top panel, sources having GBP − GRP < 0.2 mag), Group 3 (second panel from top), Group 4 (third from top) and Subgroup 4a (bottom panel) of LAVs in dataset C with parallax uncertainties better than 10%. The background grey points show the full sample of dataset C with ϖ/ε(ϖ) > 10. Evolutionary tracks of (from bottom to top) 0.8, 1, 1.5, 2, 3, and 5 M⊙ solar-metallicity stellar models from Ekström et al. (2012) are over-plotted in black, with the 1 M⊙ track rendered in thick line. The axes ranges have been limited for better visibility.
Current usage metrics show cumulative count of Article Views (full-text article views including HTML views, PDF and ePub downloads, according to the available data) and Abstracts Views on Vision4Press platform.
Data correspond to usage on the plateform after 2015. The current usage metrics is available 48-96 hours after online publication and is updated daily on week days.
Initial download of the metrics may take a while.