Fig. 23.
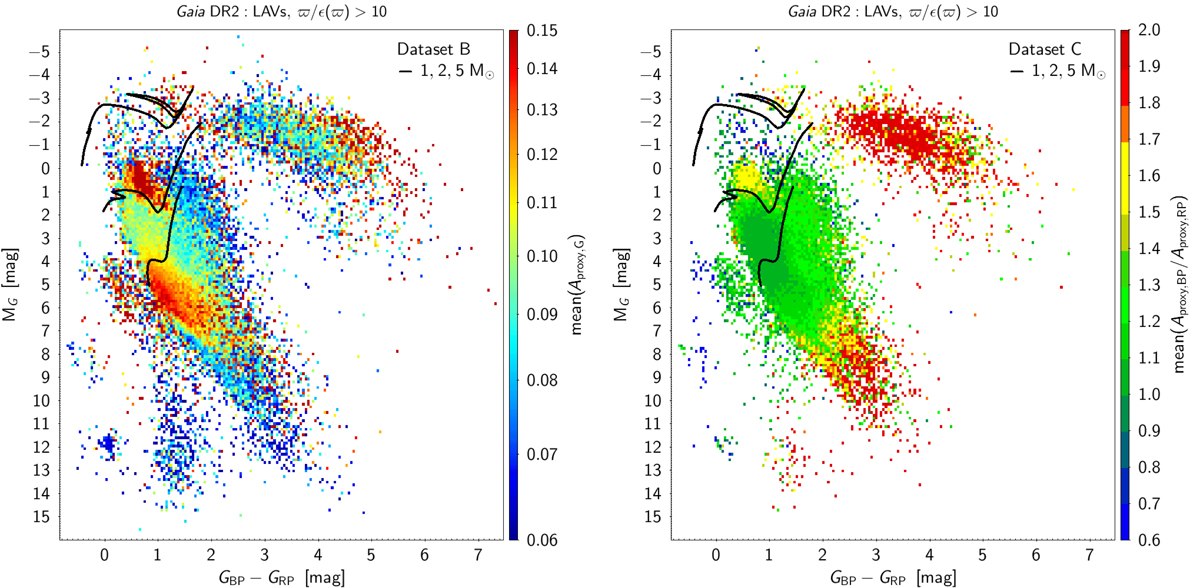
Observational HRD with the mean value of Aproxy,G from Subset Bgp (left panel) and of Aproxy,BP/Aproxy,RP from Subset Cgp (right panel) for each cell of size [Δ(GBP − GRP),ΔMG] = (0.045, 0.12) mag, plotted in colour according to the colour-scale on the right of each panel. The thin contour lines in black correspond to the density lines of the DR2 sample of constants+variables shown in Fig. 22 (bottom panel). The thick lines correspond to evolutionary tracks of (from bottom to top) 1, 2, and 5 M⊙ solar-metallicity stellar models from Ekström et al. (2012).
Current usage metrics show cumulative count of Article Views (full-text article views including HTML views, PDF and ePub downloads, according to the available data) and Abstracts Views on Vision4Press platform.
Data correspond to usage on the plateform after 2015. The current usage metrics is available 48-96 hours after online publication and is updated daily on week days.
Initial download of the metrics may take a while.