Fig. 22.
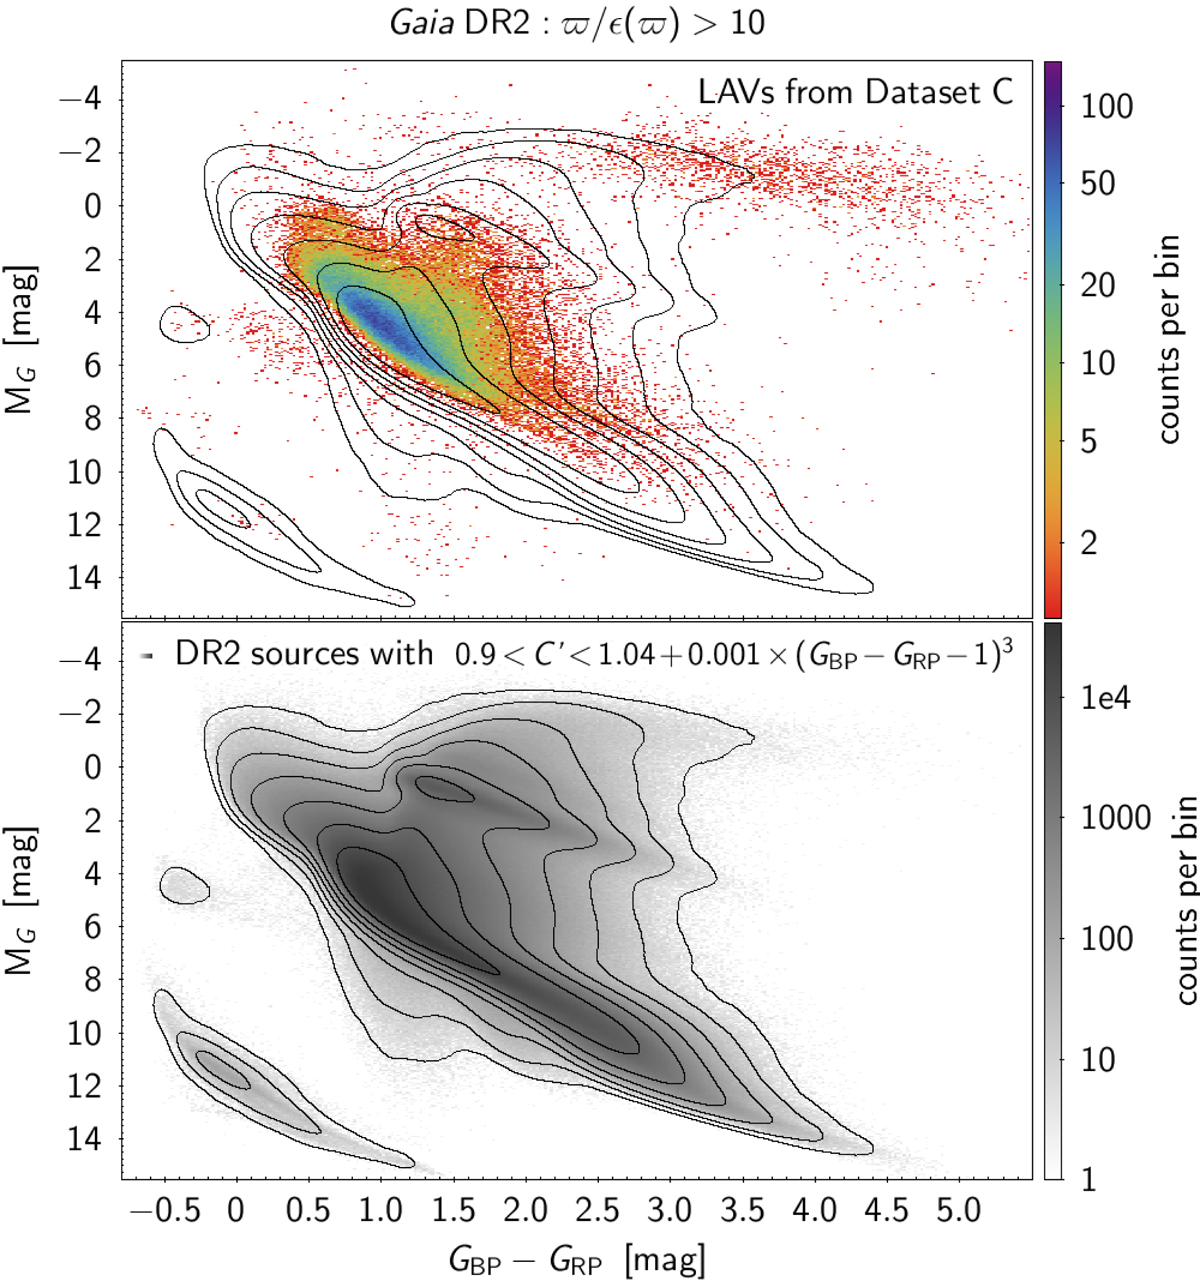
Observational HRDs of Gaia DR2 sources that have relative parallax uncertainties better than 10%. Top panel: density map of LAV candidates from Dataset C, while bottom panel: random selection of variable+constant sources with good BP and RP flux excess. The black contour lines in both panels correspond to the density lines of the sample shown in the bottom panel. No correction for interstellar reddening and extinction is applied.
Current usage metrics show cumulative count of Article Views (full-text article views including HTML views, PDF and ePub downloads, according to the available data) and Abstracts Views on Vision4Press platform.
Data correspond to usage on the plateform after 2015. The current usage metrics is available 48-96 hours after online publication and is updated daily on week days.
Initial download of the metrics may take a while.