Fig. 2.
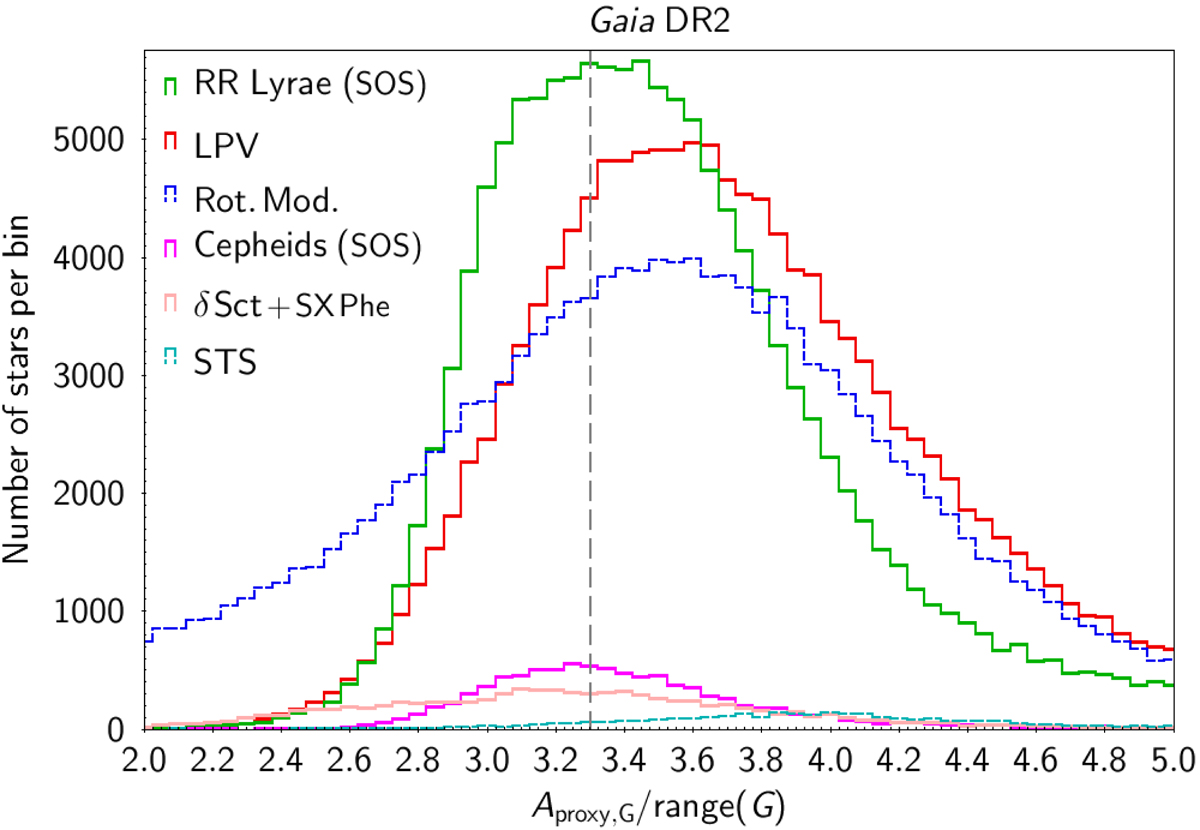
Histograms of range(G)/Aproxy,G ratio for the samples of various variability types shown in Fig. 1. The variability type corresponding to each histogram is written in the top left of the panel in the same colour as the histogram, in decreasing order of the histogram maximum. Pulsating stars are shown in continuous thick lines, while non pulsators, that is MS rotation modulation variables (Rot. Mod.) and short time-scale variables, are shown in dashed thin lines. A dashed vertical line is plotted at range(G)/Aproxy, G = 3.3.
Current usage metrics show cumulative count of Article Views (full-text article views including HTML views, PDF and ePub downloads, according to the available data) and Abstracts Views on Vision4Press platform.
Data correspond to usage on the plateform after 2015. The current usage metrics is available 48-96 hours after online publication and is updated daily on week days.
Initial download of the metrics may take a while.