Fig. 19.
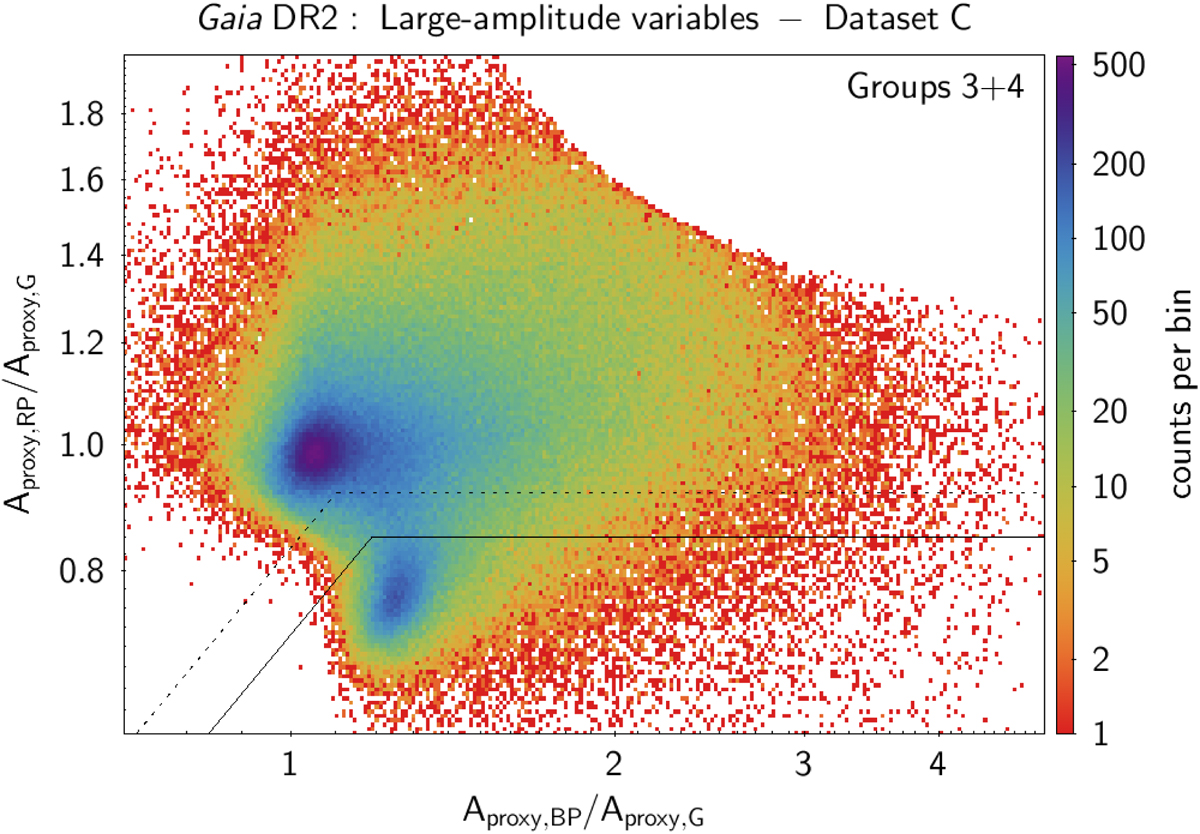
Same as Fig. 7, but for Groups 3 and 4 in Dataset C. The solid-line delineates Group 3 (below the line) and Group 4 (above the line). The dashed line identifies Subgroup 4a at the small Aproxy,RP/Aproxy, G side of Group 4 (see text). The diagonal lines are given by Aproxy,BP/Aproxy,RP = 1.2 (dashed diagonal line) and Aproxy,BP/Aproxy,RP = 1.4 (solid diagonal line).
Current usage metrics show cumulative count of Article Views (full-text article views including HTML views, PDF and ePub downloads, according to the available data) and Abstracts Views on Vision4Press platform.
Data correspond to usage on the plateform after 2015. The current usage metrics is available 48-96 hours after online publication and is updated daily on week days.
Initial download of the metrics may take a while.