Fig. 18.
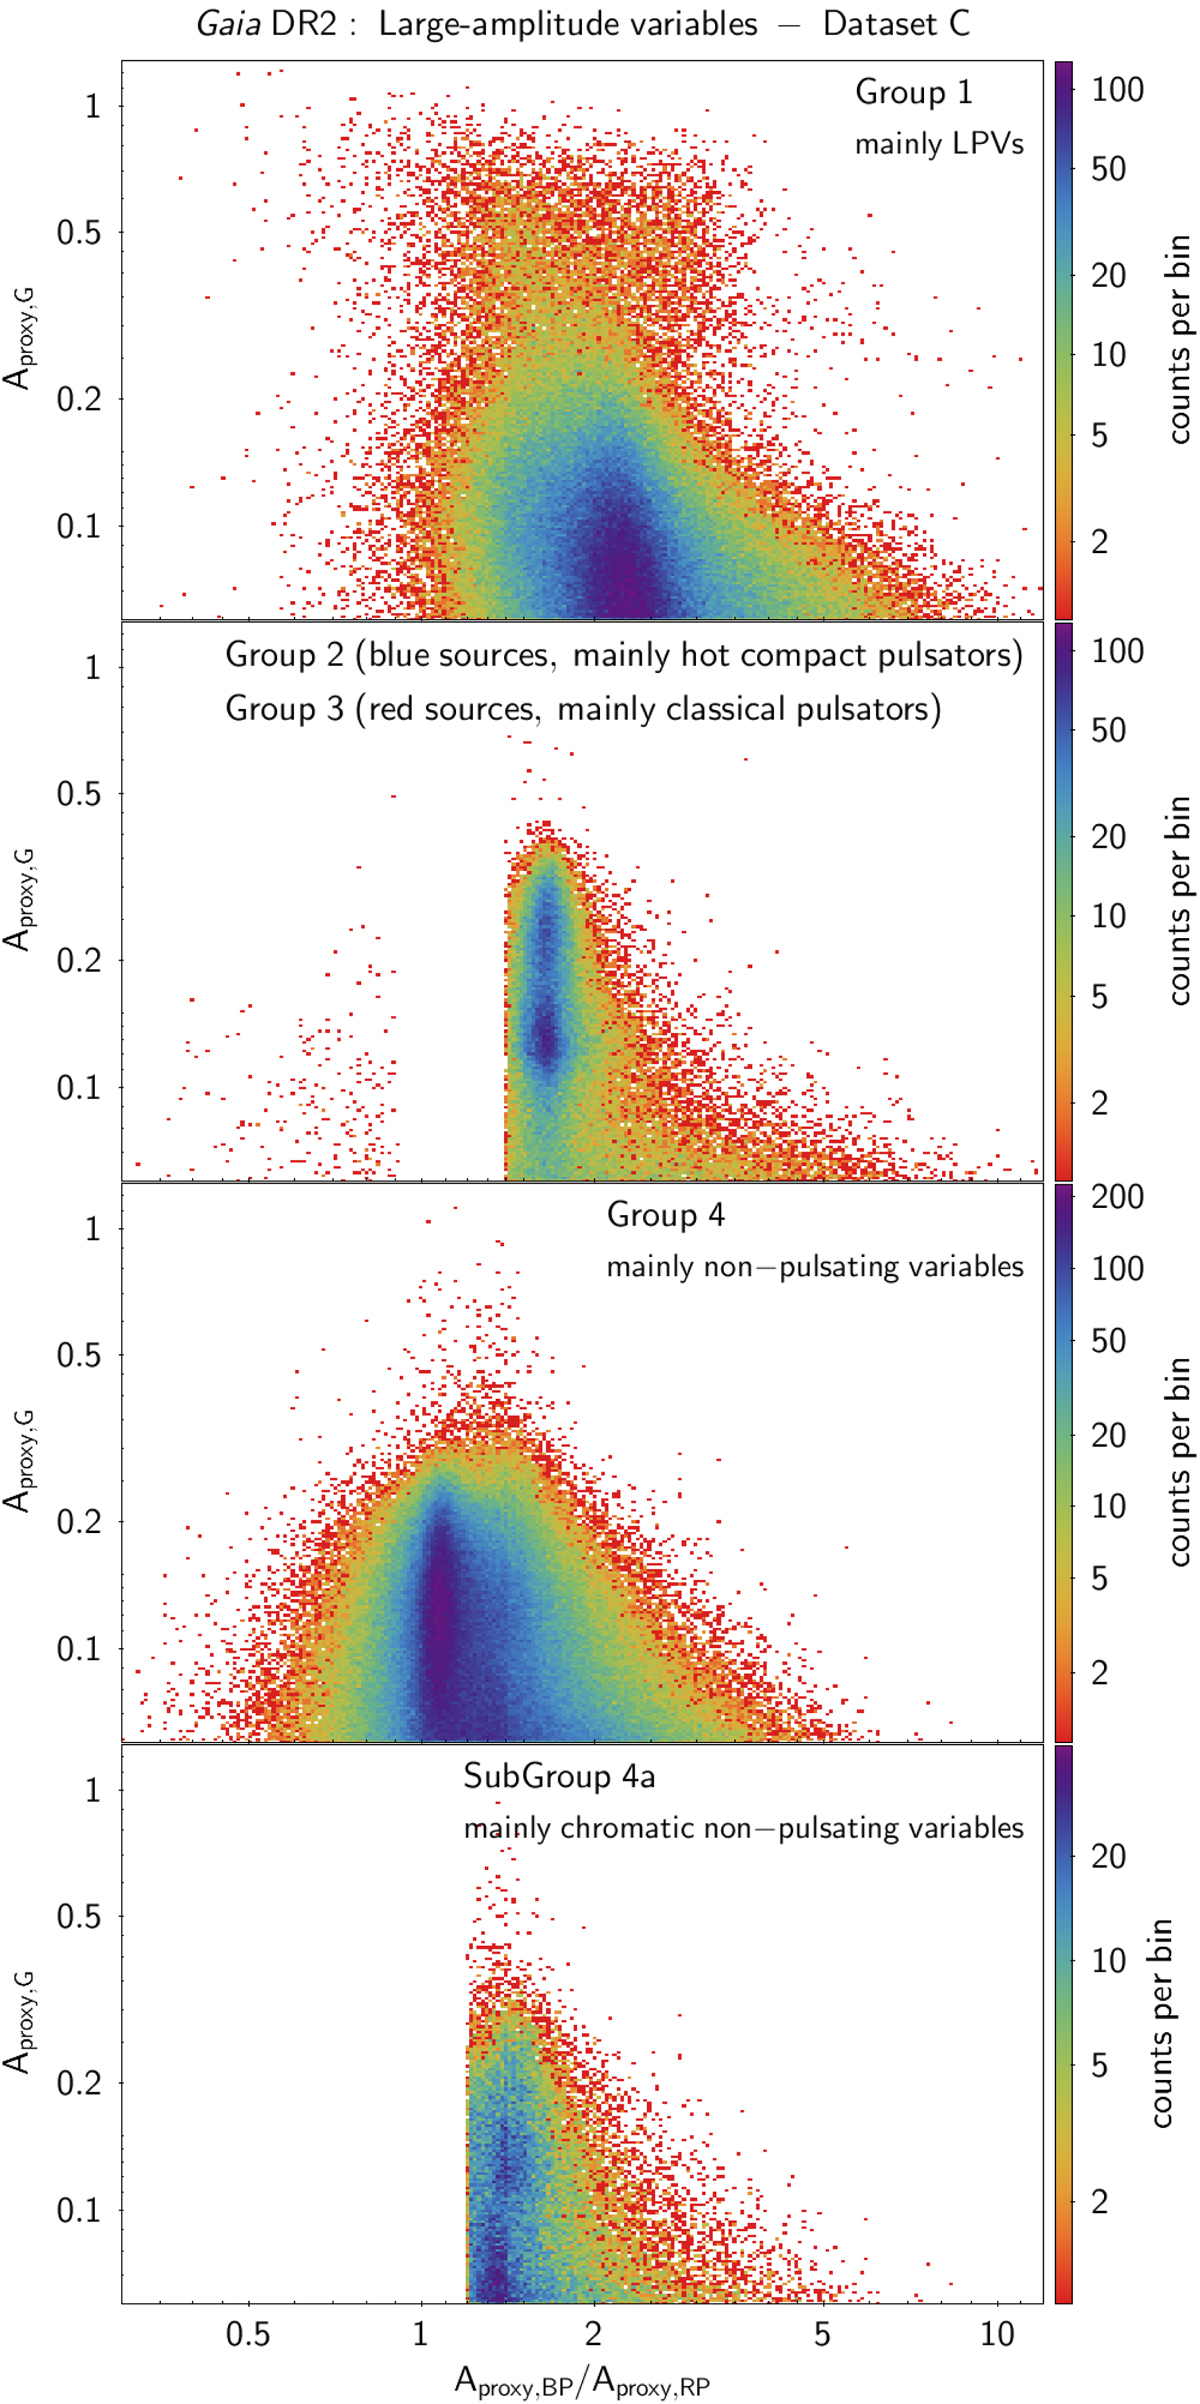
Density maps of Aproxy,G versus Aproxy,BP/Aproxy,RP for the different groups in Dataset C. Top panel: Group 1 (mainly LPVs). Second panel from top: Group 2 for sources at Aproxy,BP/Aproxy,RP < 0.9 (mainly hot compact LAVs) and Group 3 for sources at Aproxy,BP/Aproxy,RP > 1.4 (mainly classical pulsators). Third panel from top: Group 4 (mainly non-pulsating variables). Bottom panel: Subgroup 4a (mainly chromatic non-pulsating variables).
Current usage metrics show cumulative count of Article Views (full-text article views including HTML views, PDF and ePub downloads, according to the available data) and Abstracts Views on Vision4Press platform.
Data correspond to usage on the plateform after 2015. The current usage metrics is available 48-96 hours after online publication and is updated daily on week days.
Initial download of the metrics may take a while.