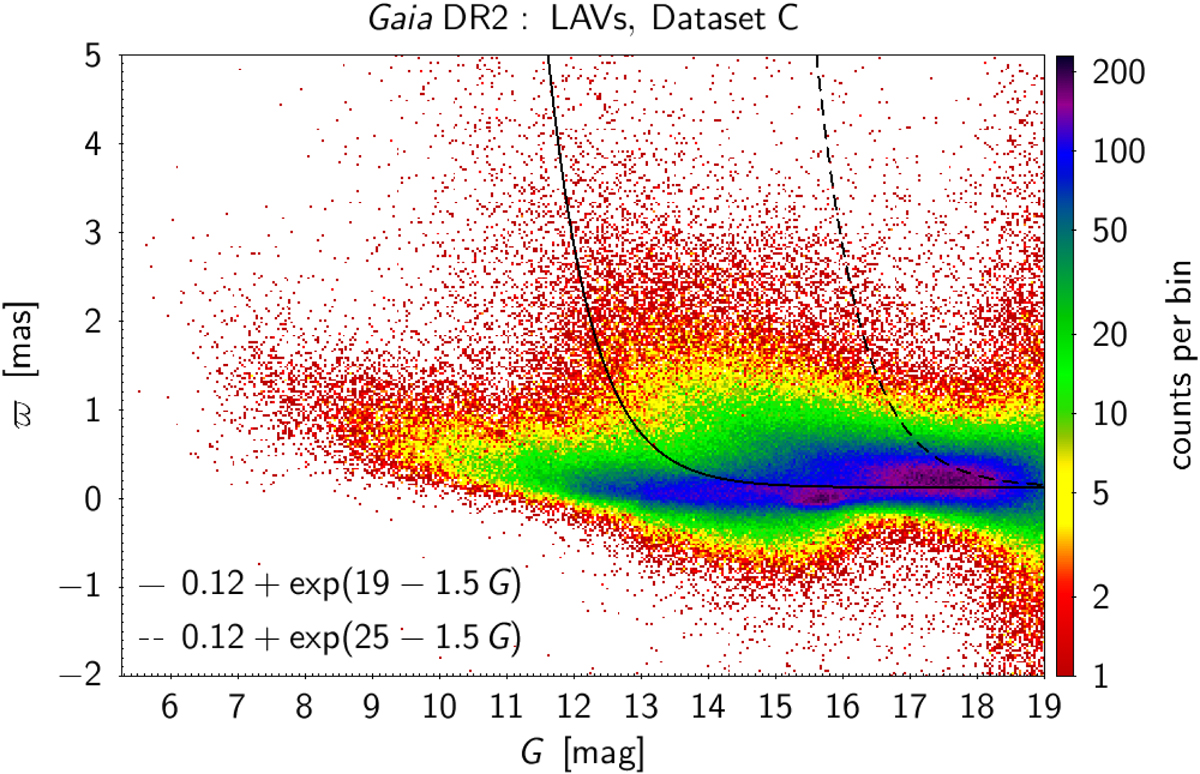
Fig. 17.

Density map of the parallax versus G for Dataset C. The lines are examples of parallax limits below which stars are classified as LPVs (for GBP − GRP = 3 mag for the solid line and for for GBP − GRP = 5 mag for the dashed line). A rainbow colour-code is used for the density map to highlight the location of the densest regions with respect to the solid and dashed lines. The axes ranges have been limited for better visibility.
Current usage metrics show cumulative count of Article Views (full-text article views including HTML views, PDF and ePub downloads, according to the available data) and Abstracts Views on Vision4Press platform.
Data correspond to usage on the plateform after 2015. The current usage metrics is available 48-96 hours after online publication and is updated daily on week days.
Initial download of the metrics may take a while.


