Fig. 16.
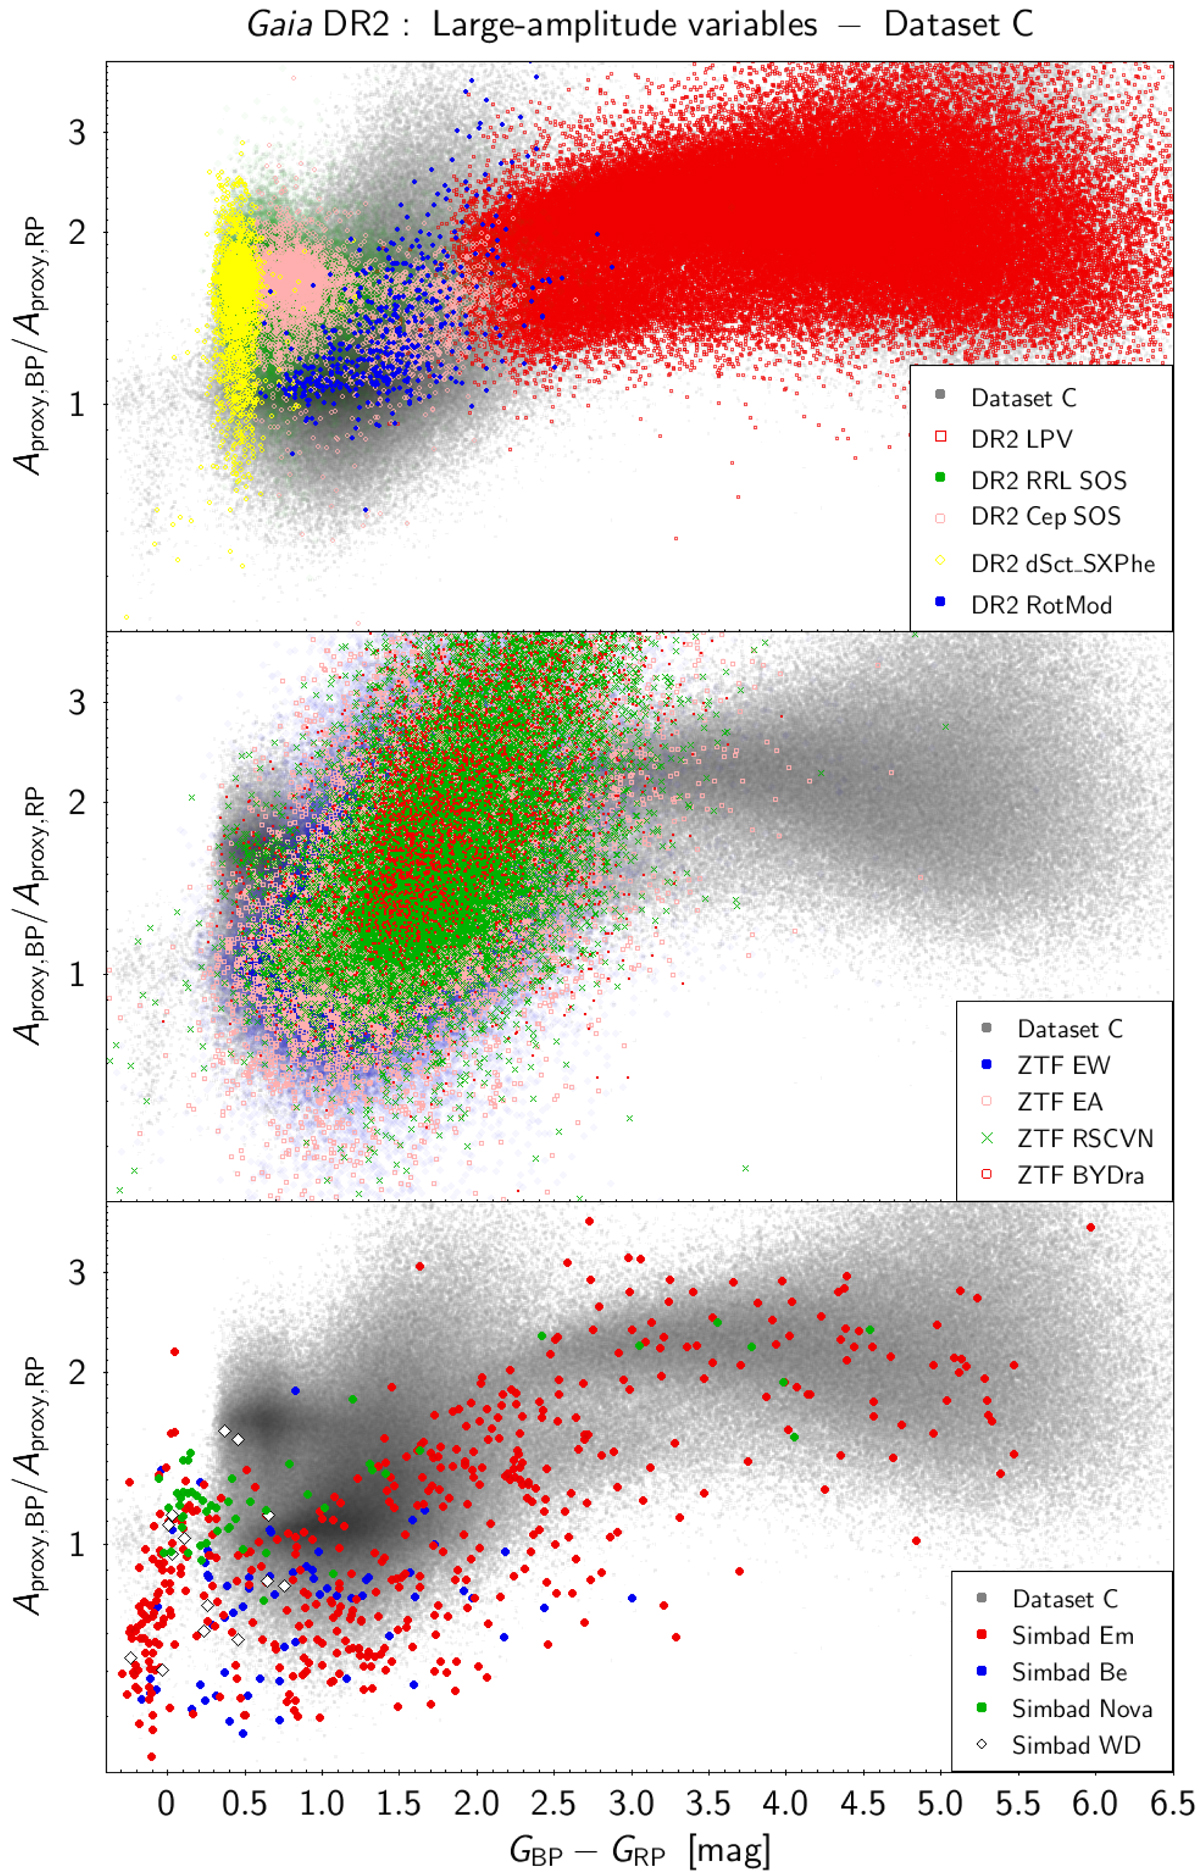
Distribution in the Aproxy,BP/Aproxy,RP versus GBP − GRP diagram of Dataset C LAVs crossmatched with some of the Gaia DR2 catalogues of variables (top panel), with the sample of non-pulsating variables from the ZTF catalogue of periodic variables (middle panel), and with a selection of variability types crossmatched in the Simbad databse. The colours of the symbols used to represent them are the same as the ones in Fig. 15. The background grey points represent the full Dataset C shown in Fig. 8. The axes ranges have been limited for better visibility.
Current usage metrics show cumulative count of Article Views (full-text article views including HTML views, PDF and ePub downloads, according to the available data) and Abstracts Views on Vision4Press platform.
Data correspond to usage on the plateform after 2015. The current usage metrics is available 48-96 hours after online publication and is updated daily on week days.
Initial download of the metrics may take a while.