Fig. 15.
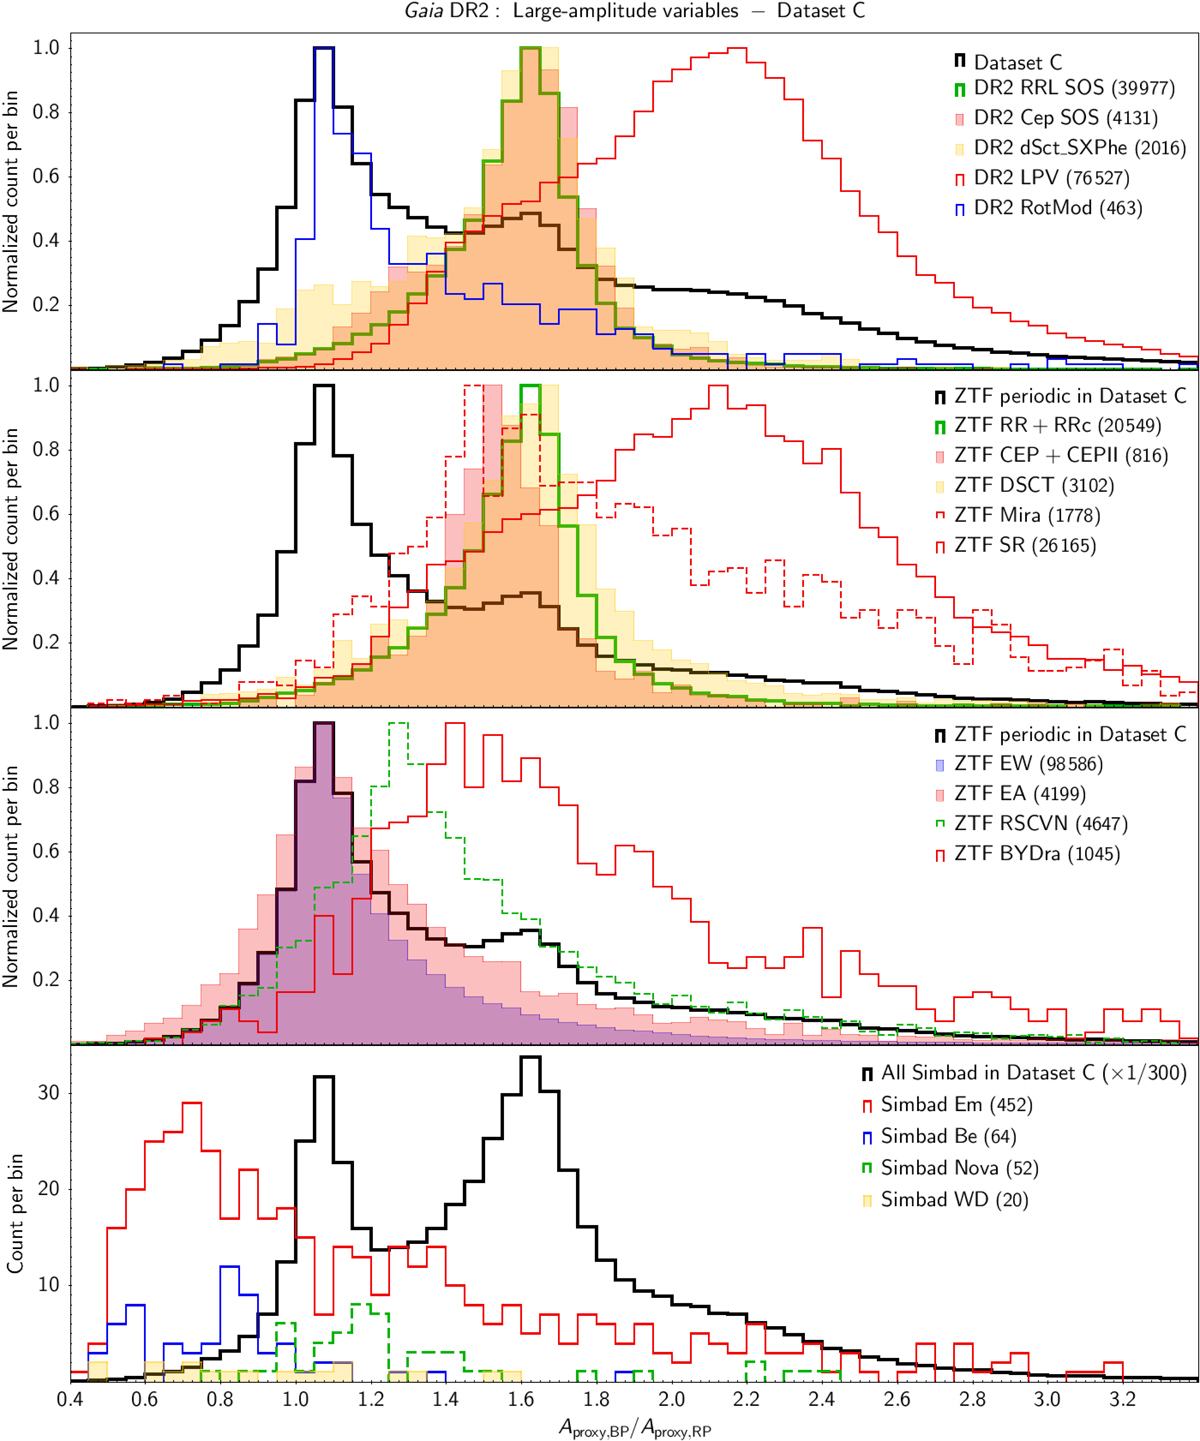
Histograms of Aproxy,BP/Aproxy,RP for various types of variable candidates identified in the catalogues of Gaia DR2 variables (top panel), in the ZTF catalogue of periodic variables (middle panels) and in Simbad (bottom panel; ‘Em’ are emission-line stars). Only crossmatches with Dataset C are considered. The variability type of each histogram is indicated in the upper-right corner of each panel, with the number of crossmatches available in Dataset C indicated in parenthesis next to the variability type. The thick black line in each panel represents the histogram of the full sample of crossmatches in Dataset C of the relevant catalogue. The histograms are normalized to maximum count in the top three panels, and the actual counts per bin in the bottom panel. The counts in the histogram of the full sample of Simbad crossmatches (thick black line in the bottom panel) have been divided by 300 for better visibility. The abscissa range has been limited for better visibility.
Current usage metrics show cumulative count of Article Views (full-text article views including HTML views, PDF and ePub downloads, according to the available data) and Abstracts Views on Vision4Press platform.
Data correspond to usage on the plateform after 2015. The current usage metrics is available 48-96 hours after online publication and is updated daily on week days.
Initial download of the metrics may take a while.