Fig. 1.
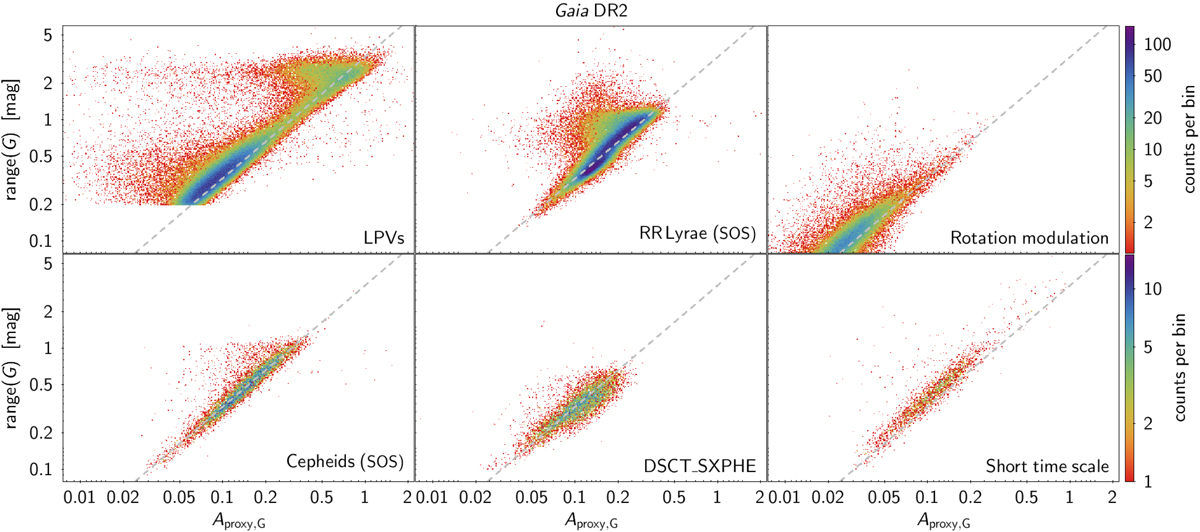
Density maps of the variability range of G time series (in ordinate) versus amplitude proxy (in abscissa) of selected variable stars published in Gaia DR2 for the variability types indicated in the upper-right corner of each panel. The RR Lyrae and Cepheid type candidates shown in the figure are restricted to the subset provided in the Specific Object Study (SOS) tables of the data release (see Holl et al. 2018, and more specifically their Fig. 3). The colours of each grid cell in the maps are related to the logarithm of the density of points in the cells according to the colour scale shown on the right of each row of panels. All panels in a given row share the same density colour scale. The dashed diagonal line in each panel corresponds to range(G) = 3.3 Aproxy, G.
Current usage metrics show cumulative count of Article Views (full-text article views including HTML views, PDF and ePub downloads, according to the available data) and Abstracts Views on Vision4Press platform.
Data correspond to usage on the plateform after 2015. The current usage metrics is available 48-96 hours after online publication and is updated daily on week days.
Initial download of the metrics may take a while.