Fig. 8.
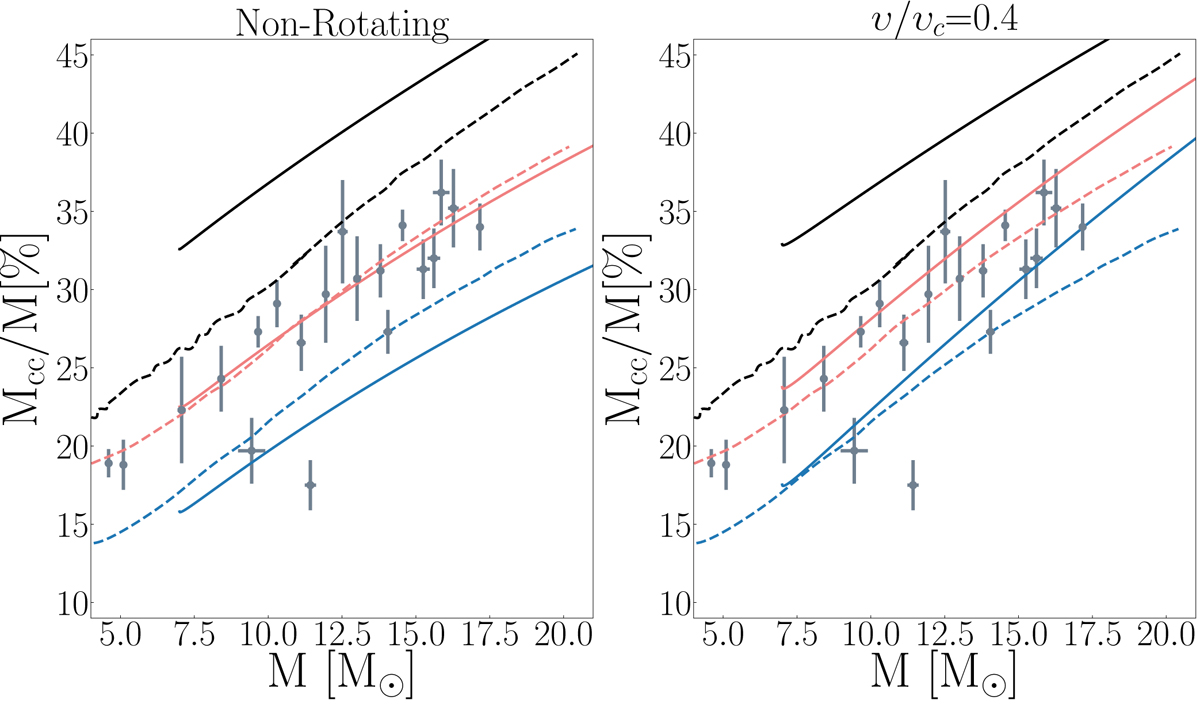
Variation of the convective core size at different stages during the core H-burning phase, as a function of the initial mass. The dashed lines are the models of Tkachenko et al. (2020) with strong convective boundary mixing, the solid ones are the present GENEC models with α = 0.2. The tracks in black correspond to the ZAMS stage, while the red tracks correspond to a stage where the mass fraction of hydrogen in the convective core (Xc) is 0.35, and the blue tracks to Xc = 0.1. The grey points show observed eclipsing binaries and their core mass estimates from Tkachenko et al. (2020). In the left panel, the GENEC models are the non-rotating ones. In the right panel, they are the υ/υcrit = 0.4 rotating ones.
Current usage metrics show cumulative count of Article Views (full-text article views including HTML views, PDF and ePub downloads, according to the available data) and Abstracts Views on Vision4Press platform.
Data correspond to usage on the plateform after 2015. The current usage metrics is available 48-96 hours after online publication and is updated daily on week days.
Initial download of the metrics may take a while.