Fig. 7.
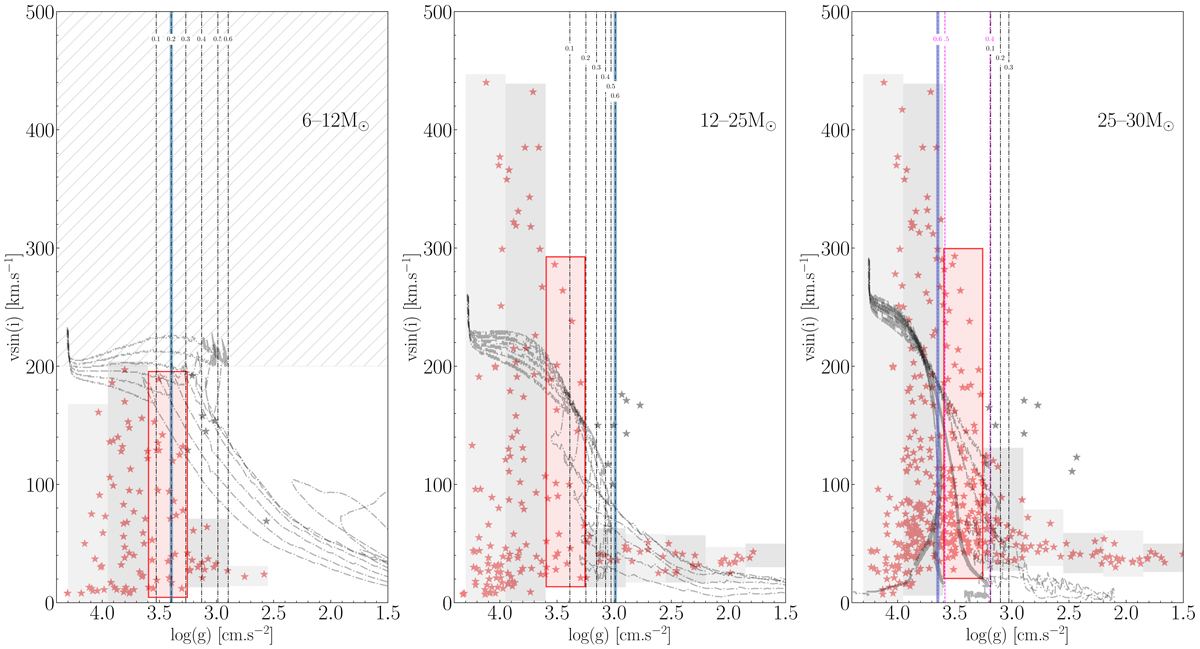
Comparison of observed and predicted surface velocities as a function of surface gravity. In each panel, the light grey dashed tracks show the evolution for a given initial mass model of the surface equatorial velocity as a function of the surface gravity, with overshooting equal to 0.1, 0.2, 0.3, 0.4, 0.5, and 0.6 (from left to right, except for the right panel, where models, due to blueward evolution at α ≥ 0.4, goes as 0.6, 0.5, 0.4,0.1, 0.2, 0.3 from left to right). The models have been computed with υ/υcrit = 0.4 and a moderate angular momentum transport. Models with an initial mass equal respectively to 9, 15, and 25 M⊙ are plotted in the left, middle, and right panel. The vertical lines shows for each overshooting value, the value of the log(g) where the expected υsin(i) drop is predicted to occur. The one shadowed in blue shows the case corresponding to the model with the overshoot deduced from the MS band’s width (see Sect. 4.1). The colored stars are observed υsin(i) given by Simón-Díaz et al. (2017) catalogue and brand new O-star sample with high υsin(i) from Holgado et al. (in prep.). For the mid/late B-stars, Simón-Díaz et al. (2017) excluded from their sample all stars with υsin(i) > 200km s−1 to study macroturbulent broadening (hatched zone in the left panel). In each panel, we plot only those stars showing a position in the HR diagram indicating that they have a mass near the one of the plotted stellar models. In each panel, the red band indicates the region where the υsin(i) drop likely occurs. To determine its position, we use both observations and considerations based on the mock observations shown in Fig. 5 (see text). In that process, however, we do not take into account the grey stars that, according to Holgado et al. (in prep.; see Fig. 1 in Britavskiy et al. 2020), might be the result of the evolution of an interacting binary system.
Current usage metrics show cumulative count of Article Views (full-text article views including HTML views, PDF and ePub downloads, according to the available data) and Abstracts Views on Vision4Press platform.
Data correspond to usage on the plateform after 2015. The current usage metrics is available 48-96 hours after online publication and is updated daily on week days.
Initial download of the metrics may take a while.