Free Access
Fig. 6.
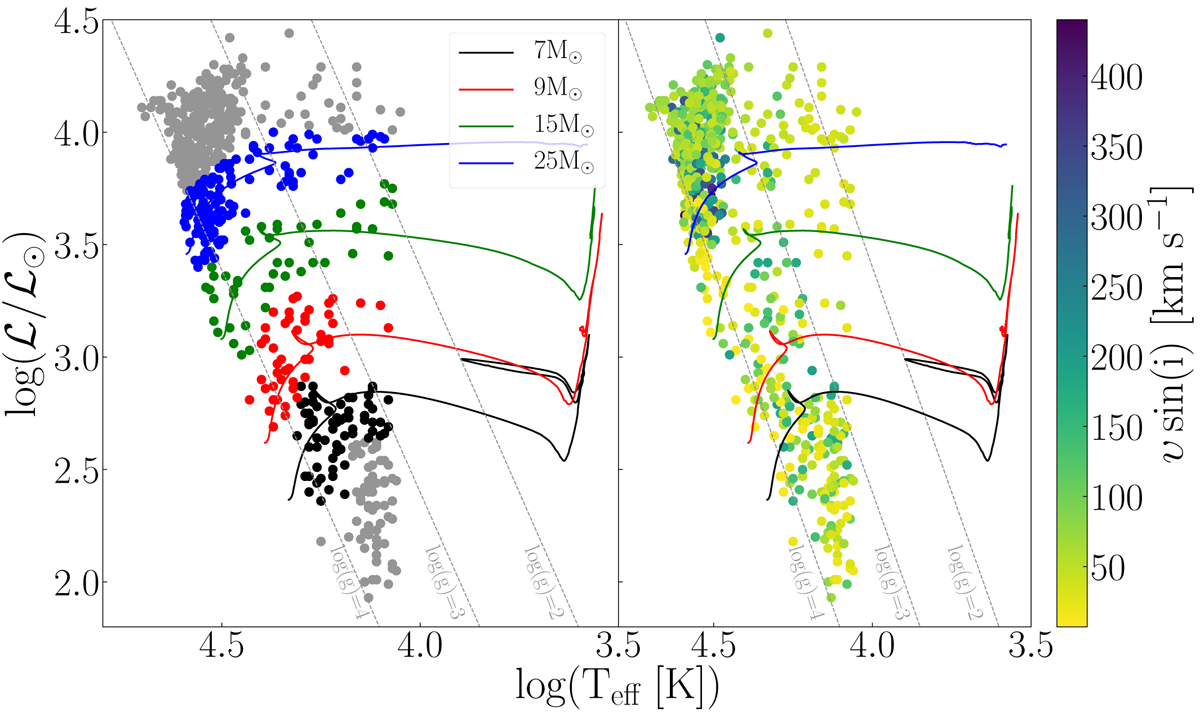
Positions of the stars with a determined υsin(i) taken from Simón-Díaz et al. (2017) and Holgado et al. (2020, and in prep.) in the spectroscopic HR diagram. The evolutionary tracks correspond to non-rotating tracks with an α = 0.3. The left-panel shows the mass selection and the right panel shows the υsin(i) distribution.
Current usage metrics show cumulative count of Article Views (full-text article views including HTML views, PDF and ePub downloads, according to the available data) and Abstracts Views on Vision4Press platform.
Data correspond to usage on the plateform after 2015. The current usage metrics is available 48-96 hours after online publication and is updated daily on week days.
Initial download of the metrics may take a while.