Fig. 4.
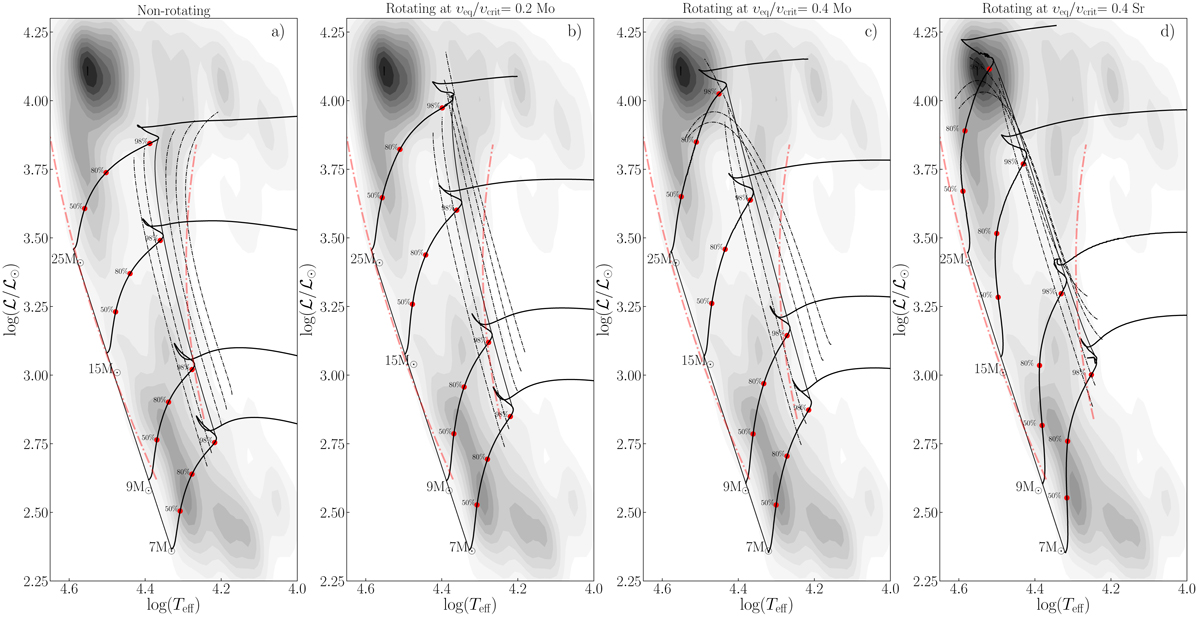
Spectroscopic Hertzsprung-Russell diagrams (Langer & Kudritzki 2014, ![]() /g) for non-rotating, rotating at υ/υcrit = 0.2, and rotating at υ/υcrit = 0.4 with moderate and strong transport. The black solid lines connecting the red hooks of the tracks show the TAMS position for alpha = 0.3, the dashed lines show the TAMS line for overshoot parameters equal to 0.1, 0.2, 0.4, 0.5, and 0.6. The dashed-dotted red lines show respectively the empirical ZAMS (on the left in each panel) and the empirical TAMS limit (on the right in each panel) given by Castro et al. (2014). The shaded areas show the kernel density estimation of stars from Castro et al. (2014) sample. It uses a Gaussian kernel, and the darker is the area, the higher is the proportion of the estimated underlying distribution that sits in that range.
/g) for non-rotating, rotating at υ/υcrit = 0.2, and rotating at υ/υcrit = 0.4 with moderate and strong transport. The black solid lines connecting the red hooks of the tracks show the TAMS position for alpha = 0.3, the dashed lines show the TAMS line for overshoot parameters equal to 0.1, 0.2, 0.4, 0.5, and 0.6. The dashed-dotted red lines show respectively the empirical ZAMS (on the left in each panel) and the empirical TAMS limit (on the right in each panel) given by Castro et al. (2014). The shaded areas show the kernel density estimation of stars from Castro et al. (2014) sample. It uses a Gaussian kernel, and the darker is the area, the higher is the proportion of the estimated underlying distribution that sits in that range.
Current usage metrics show cumulative count of Article Views (full-text article views including HTML views, PDF and ePub downloads, according to the available data) and Abstracts Views on Vision4Press platform.
Data correspond to usage on the plateform after 2015. The current usage metrics is available 48-96 hours after online publication and is updated daily on week days.
Initial download of the metrics may take a while.