Fig. 3.
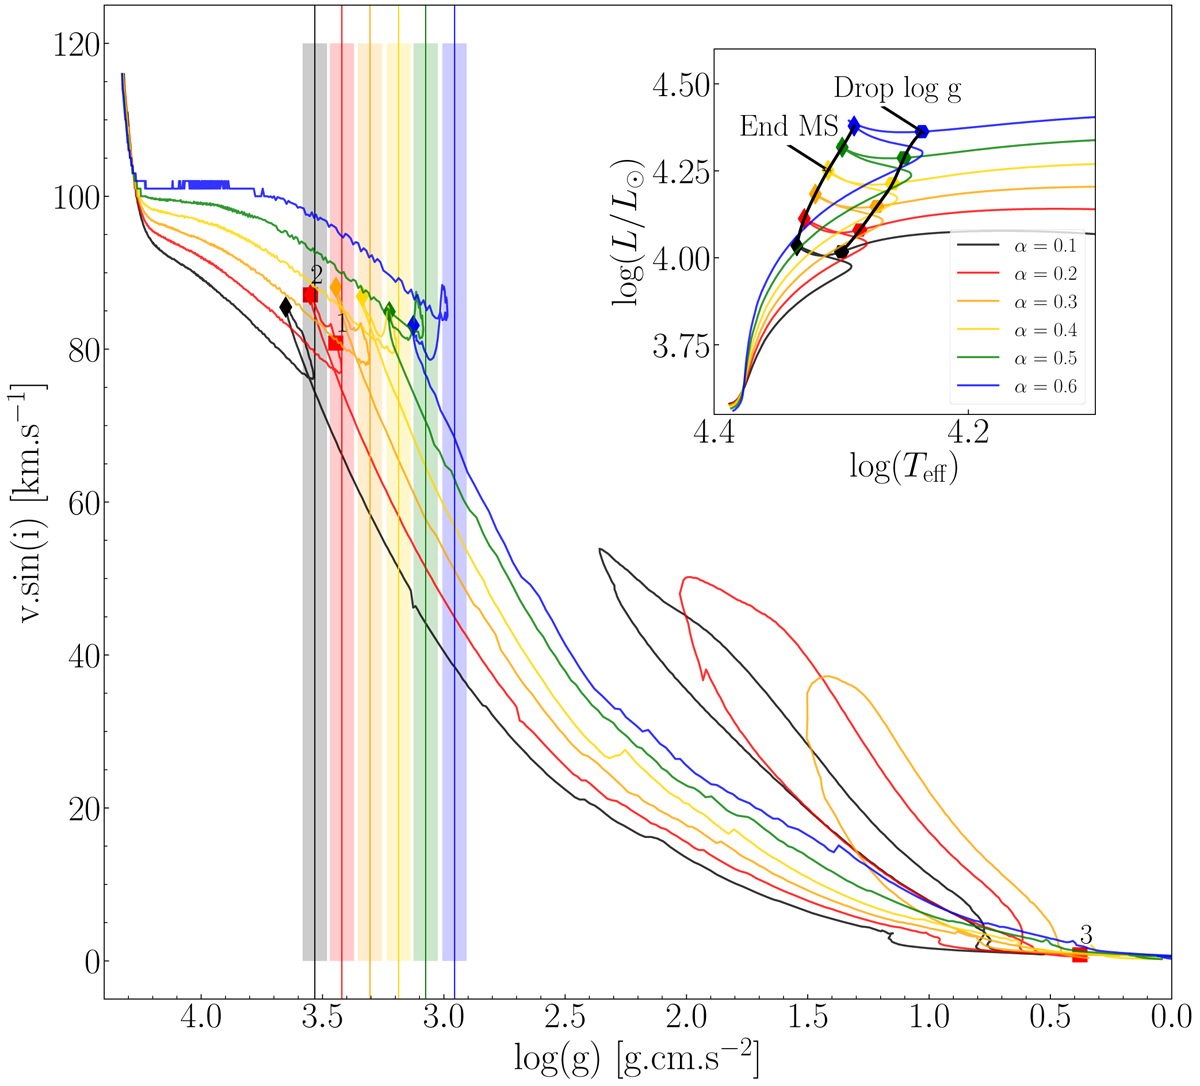
Evolution of the surface velocity as a function of the surface gravity for 9 M⊙ stars rotating at υ/υcrit = 0.2 with overshooting scaling from 0.1 to 0.6, computed with a moderate angular momentum transport. The vertical lines show the log(g) maximizing the ratio between the time spent on the left side of the shaded area and the time spent on the right side, computed with Eq. (2). Diamonds show the end of the MS. Numbers associated with red squares are separated by 105 yr from one another, with square (2) being the end of the MS. In the upper right corner is the HRD of the same models, with the location of the velocity drop indicated. The drop occurs nearly at the same position as the red hook and thus this feature can be used to observationally detect its position.
Current usage metrics show cumulative count of Article Views (full-text article views including HTML views, PDF and ePub downloads, according to the available data) and Abstracts Views on Vision4Press platform.
Data correspond to usage on the plateform after 2015. The current usage metrics is available 48-96 hours after online publication and is updated daily on week days.
Initial download of the metrics may take a while.