Fig. 1.
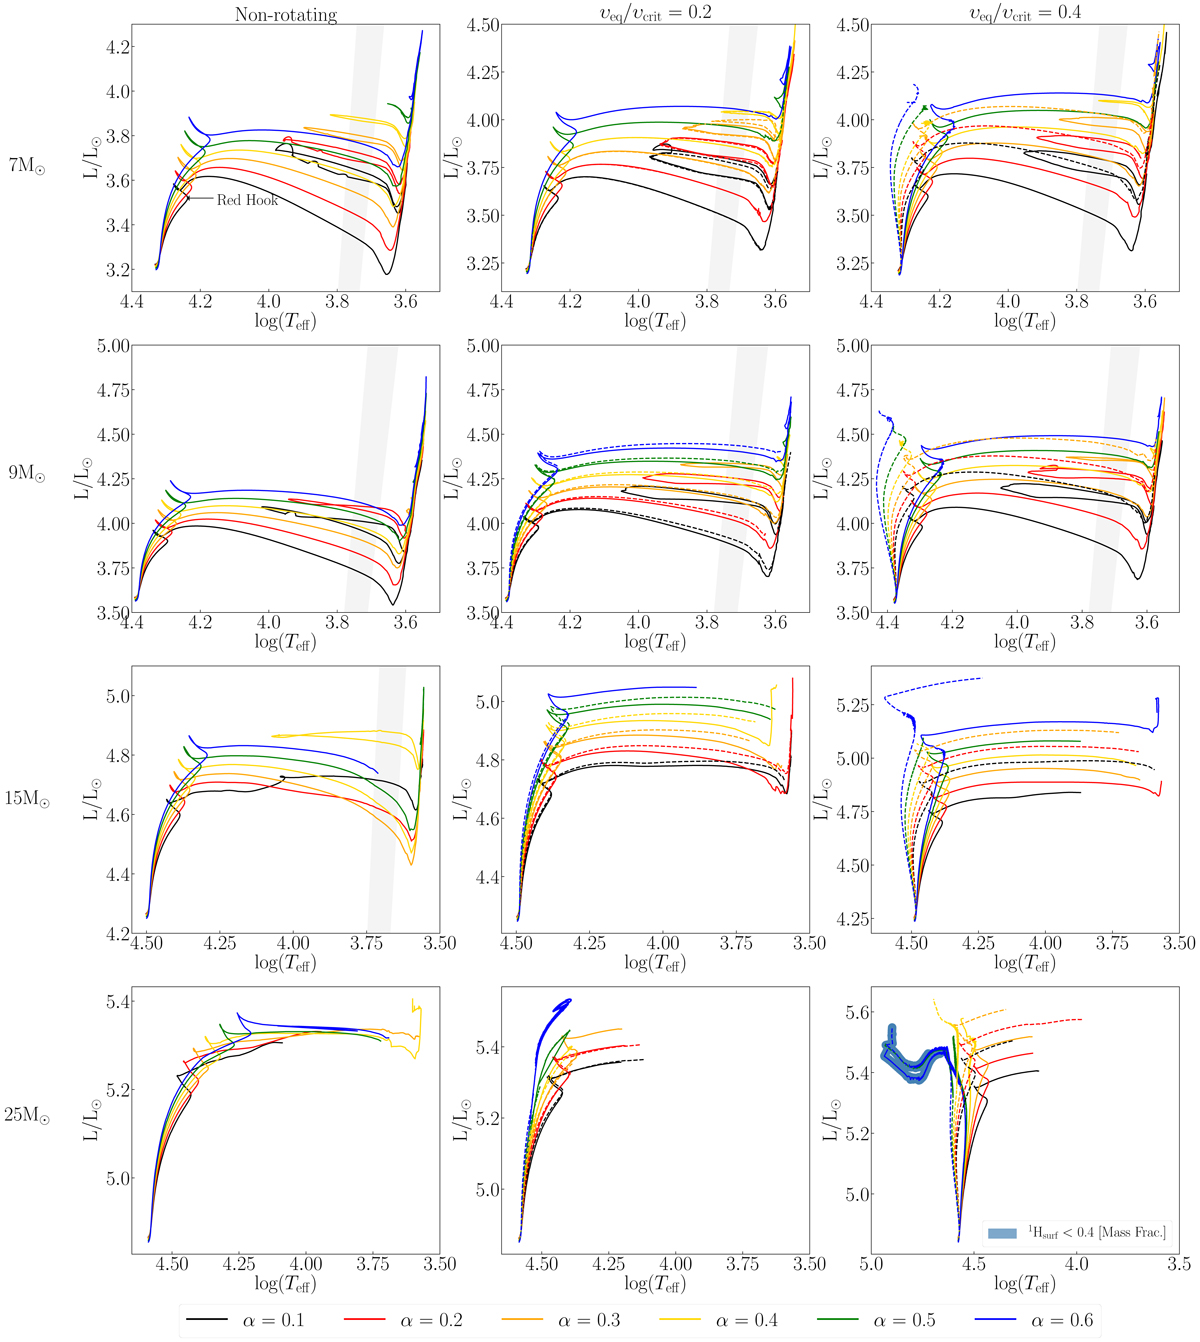
Evolutionary tracks in the Hertzsprung-Russell diagrams. Non-rotating models are shown in the panels in the left column. The plain lines in the panels of the middle and right column are the rotating models with a moderate angular momentum transport. The dashed lines are the models computed with a strong angular momentum transport. We note that at low rotations (υ/υcrit = 0.2), models with moderate and strong angular momentum transport may overlap nearly exactly preventing to see the dashed lines (see e.g., the 7 M⊙ stellar model). The shaded area shows the instability strip (determined as in Anderson et al. 2016). The models were computed up to MS turnoff for most stars, the lowest mass stars were expended up to the end of He-burning. In the bottom right panel, the parts of the tracks where the mass fraction of hydrogen at the surface is below 0.4, meaning the star may be considered a Wolf-Rayet, are highlighted by a broad blue band.
Current usage metrics show cumulative count of Article Views (full-text article views including HTML views, PDF and ePub downloads, according to the available data) and Abstracts Views on Vision4Press platform.
Data correspond to usage on the plateform after 2015. The current usage metrics is available 48-96 hours after online publication and is updated daily on week days.
Initial download of the metrics may take a while.