Fig. 6.
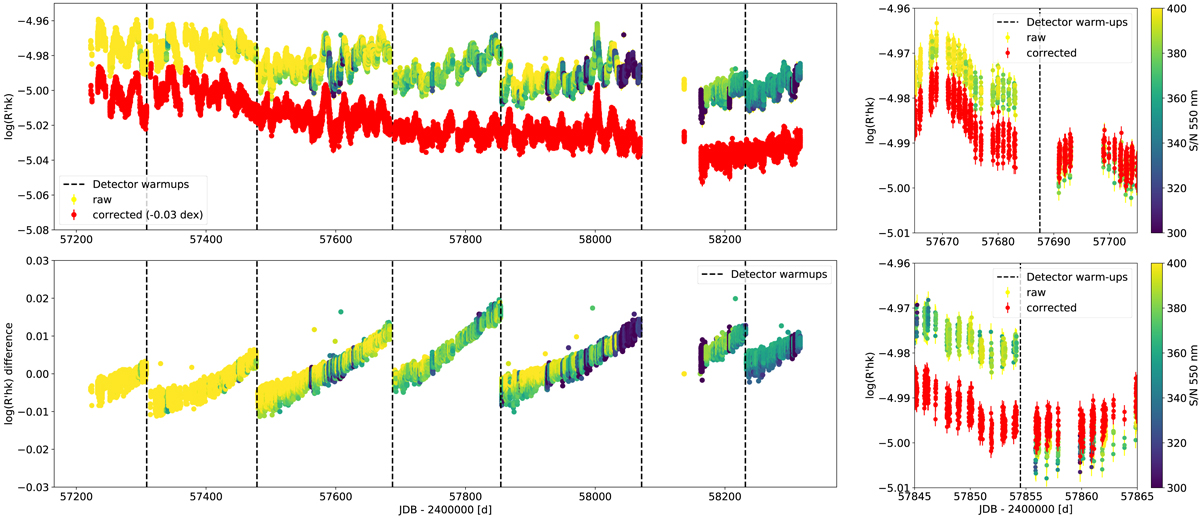
Top left: comparison between the raw (dots with yellow to blue colour scale) and corrected (red dots) log(![]() ) calcium activity index, as described in the text. Bottom left: differences between the raw and corrected log(
) calcium activity index, as described in the text. Bottom left: differences between the raw and corrected log(![]() ) time series. We clearly see that the slow increase in the activity index followed by sudden jumps at each warm-up of the detector seen in the raw log(
) time series. We clearly see that the slow increase in the activity index followed by sudden jumps at each warm-up of the detector seen in the raw log(![]() ) time series is strongly reduced after correction. Top and bottom right: closer look at the regions around the third and fourth warm-ups.
) time series is strongly reduced after correction. Top and bottom right: closer look at the regions around the third and fourth warm-ups.
Current usage metrics show cumulative count of Article Views (full-text article views including HTML views, PDF and ePub downloads, according to the available data) and Abstracts Views on Vision4Press platform.
Data correspond to usage on the plateform after 2015. The current usage metrics is available 48-96 hours after online publication and is updated daily on week days.
Initial download of the metrics may take a while.