Fig. 5.
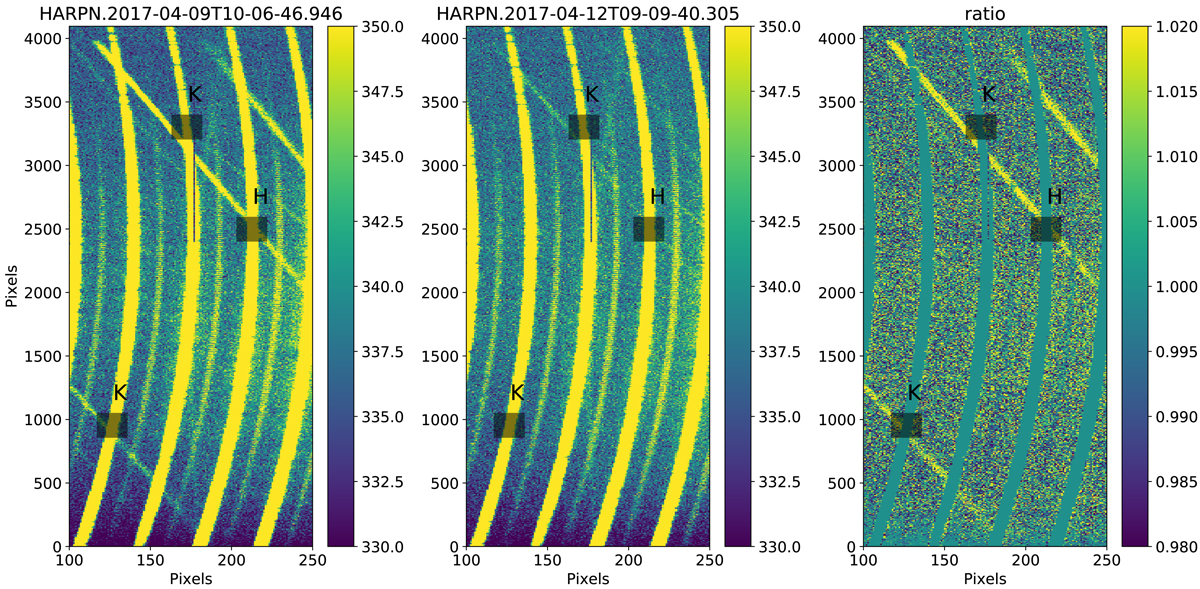
Raw images from HARPS-N taken before (HARPN.2017-04-09T10-06-46.946, left panel) and after (HARPN.2017-04-12T09-09-40.305, middle panel) a warm-up of the detector, and their ratio (right panel). The location of the core of the Ca II K and H lines in orders one, two, and three is highlighted by grey boxes. As we can see, the core of the Ca II K line in order one (K, bottom left) and the H line in order three (H) are strongly contaminated by ghosts. In addition, we also see that the contamination due to ghosts is significantly reduced with the warm-up process, which removes the humidity accumulated over time on the detector due to a small leak in its cryostat.
Current usage metrics show cumulative count of Article Views (full-text article views including HTML views, PDF and ePub downloads, according to the available data) and Abstracts Views on Vision4Press platform.
Data correspond to usage on the plateform after 2015. The current usage metrics is available 48-96 hours after online publication and is updated daily on week days.
Initial download of the metrics may take a while.