Fig. 4.
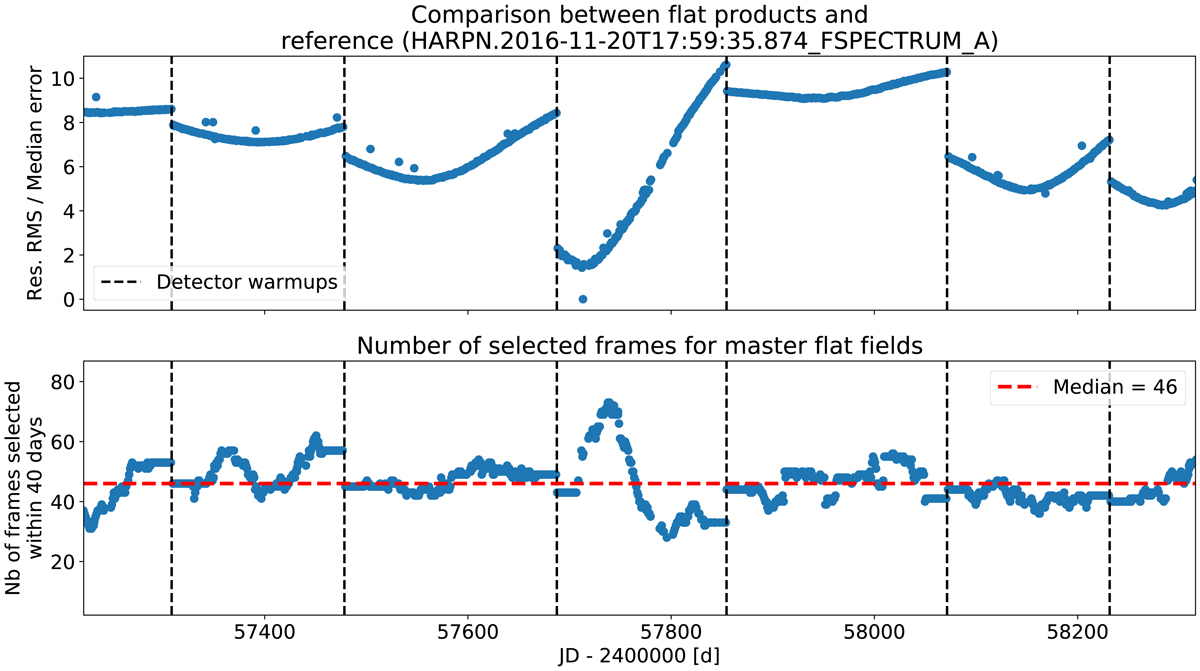
Top: variation of the flat fields over time. Here, we show the ratio between the rms and the median error of the residuals obtained by dividing all the flats by one of reference (HARPN.2016-11-20T17:59:35.874_FSPECTRUM_A.fits). Sudden jumps can be explained by periodic detector warm-ups (dashed vertical lines). Bottom: number of raw frames used to build the master flat fields. This number has to be compared to five, which is the number of raw frames included in the old HARPS-N flat field products, and 56, which is the median number of solar observations per day.
Current usage metrics show cumulative count of Article Views (full-text article views including HTML views, PDF and ePub downloads, according to the available data) and Abstracts Views on Vision4Press platform.
Data correspond to usage on the plateform after 2015. The current usage metrics is available 48-96 hours after online publication and is updated daily on week days.
Initial download of the metrics may take a while.