Fig. 3.
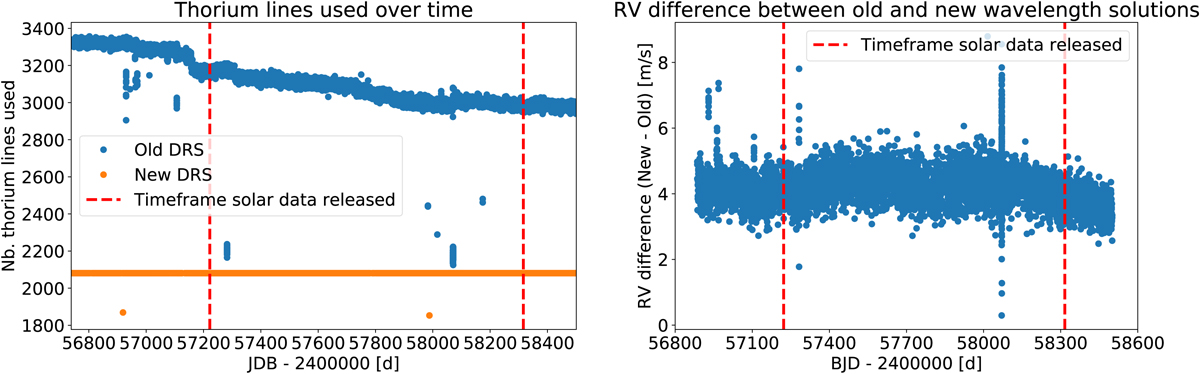
Left: number of thorium lines used over time to perform the wavelength solution in the old and new HARPS-N DRS. Here, we show the results for all thorium–thorium and thorium–Fabry-Pérot calibrations. We see that there is a significant variation in the number of lines used in the old HARPS-N DRS, 16%, while in the new HARPS-N DRS, we nearly always used 2041 thorium lines. Right: RV difference between the wavelength solutions obtained with the old HARPS-N DRS and the new one, which uses the drift map method with the new set of thorium lines.
Current usage metrics show cumulative count of Article Views (full-text article views including HTML views, PDF and ePub downloads, according to the available data) and Abstracts Views on Vision4Press platform.
Data correspond to usage on the plateform after 2015. The current usage metrics is available 48-96 hours after online publication and is updated daily on week days.
Initial download of the metrics may take a while.