Fig. 2.
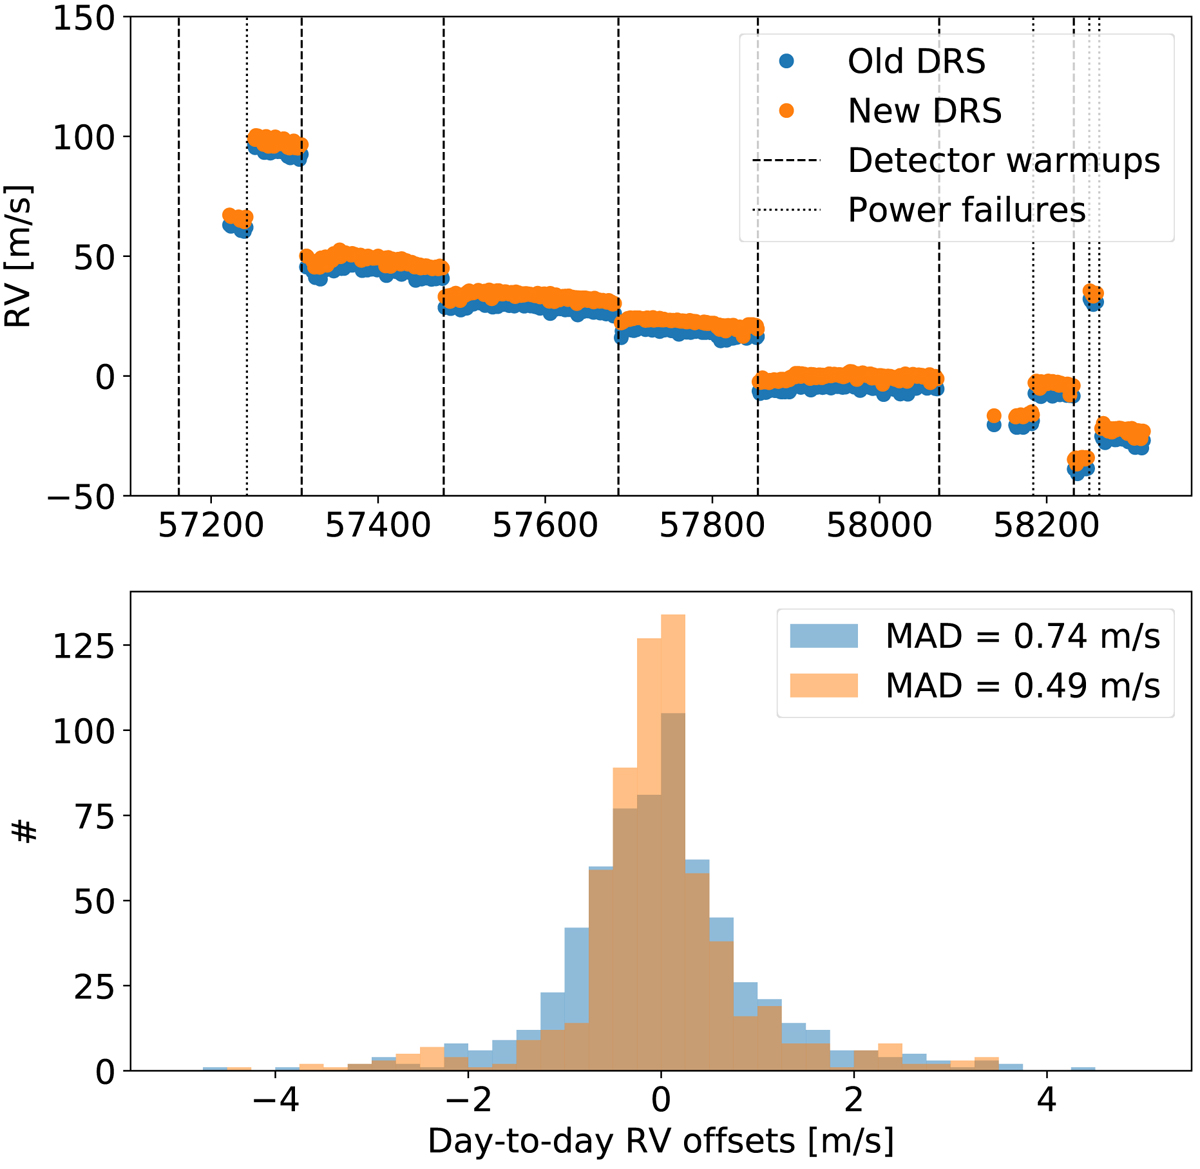
RV stability of the wavelength solutions derived with the old (blue) and new (orange) DRS. Top: RV drift of HARPS-N over time, measured by computing the RV drift between all wavelength solutions and the wavelength solution of reference (set for 2017 November 11, see text). We see a general drift over time, interrupted by significant jumps at each warm-up of the detector and power failures (dashed and dotted vertical lines). Bottom: distribution of the RV offsets measured between consecutive wavelength solutions separated by less than 1.5 days, which removes the large offsets observed at each instrument intervention. The MAD of these day-to-day RV offsets is 0.74 and 0.49 m s−1 for the old and new DRS, respectively.
Current usage metrics show cumulative count of Article Views (full-text article views including HTML views, PDF and ePub downloads, according to the available data) and Abstracts Views on Vision4Press platform.
Data correspond to usage on the plateform after 2015. The current usage metrics is available 48-96 hours after online publication and is updated daily on week days.
Initial download of the metrics may take a while.