Fig. D.1.
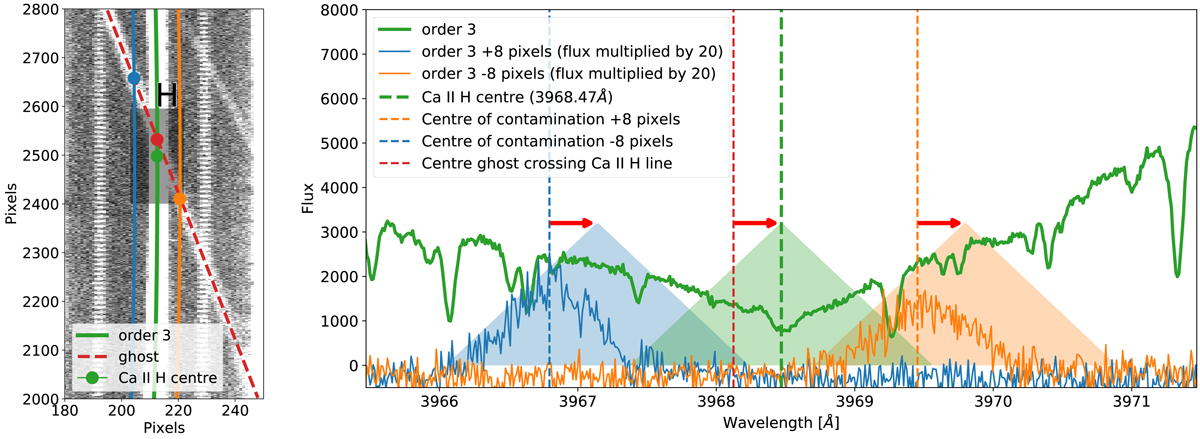
Derivation of the chromospheric emission in the core of the Ca II H line with estimation of the contamination induced by the perturbing ghost. Left: raw image centred on extracted order three with the position of the Ca II H line core. Right: extracted spectra at different positions. The green spectrum is the stellar spectrum extracted from order three (green line on the left panel). The blue and orange spectra are the flux optimally extracted, using the same order profile as order three, minus and plus eight pixels in the cross-dispersion direction on each side of order three (blue and orange lines on the left panel). We note that the extracted fluxes for those spectra have been multiplied by 20 to highlight the contamination from the ghost (red dashed line in the left panel). The vertical green dashed line corresponds to the centre of the Ca II H line core (green dot on the left panel), and the blue and orange vertical dashed lines correspond to the centre of the ghost on both sides of order three (blue and orange dots on the left panel). Assuming that the ghost does not show any curvature, which is a good approximation from one side of the order to the other, we measured the crossing of the ghost and order three (red dot in left panel, and red vertical dashed line in the right panel) as the middle between the orange and blue dots. To measure the chromospheric emission in the core of the Ca II H, the extracted flux from the green spectrum was multiplied with the triangular green response of width 1.09 Å (Vaughan et al. 1978). To measure the effective ghost contamination, we multiplied the contaminating flux on the blue and the orange spectra with the same triangular response, taking into account that the ghost does not cross order three at the centre of the Ca II H line core (the difference is highlighted by the red arrows). Finally, the contamination inside the core of the Ca II H line is taken as the average of the contaminating flux on both sides of the orders.
Current usage metrics show cumulative count of Article Views (full-text article views including HTML views, PDF and ePub downloads, according to the available data) and Abstracts Views on Vision4Press platform.
Data correspond to usage on the plateform after 2015. The current usage metrics is available 48-96 hours after online publication and is updated daily on week days.
Initial download of the metrics may take a while.