Fig. C.2.
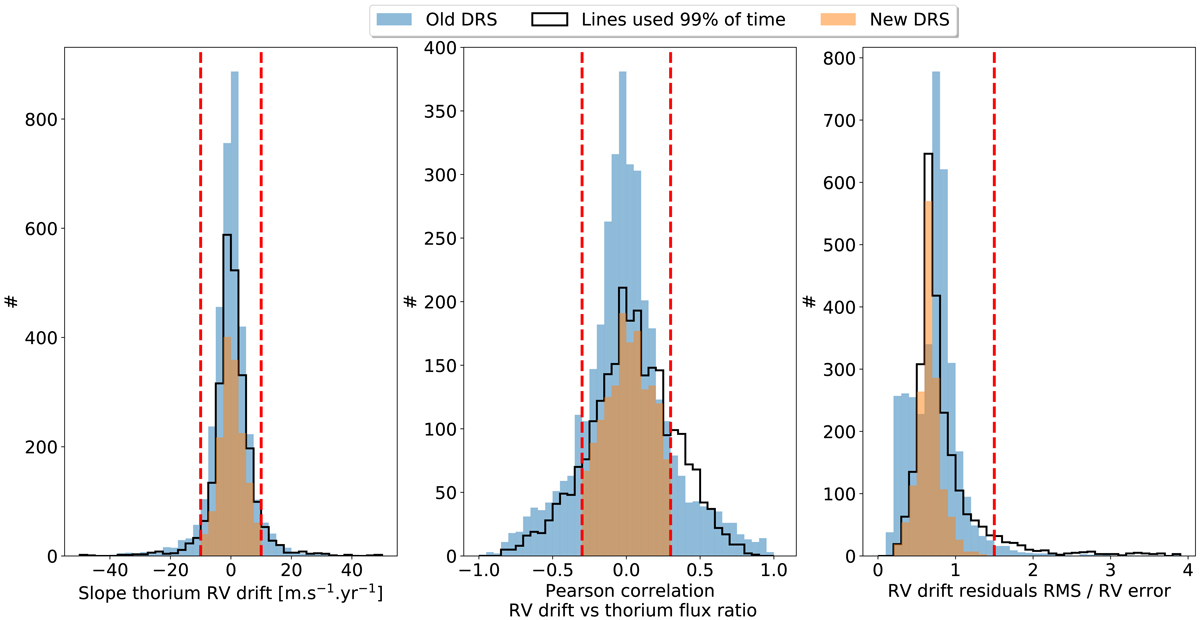
Left: slope measured on the RV drift of all the thorium lines used in the old (blue) and new (orange) DRS. Middle: Pearson correlation coefficient between the RV drift of each thorium line and the thorium flux ratio (see Fig. C.1). Right: rms of the RV drift residuals when subtracting the measured linear drift, divided by the median error in RV. For each subplot, the red vertical dashed lines correspond to the cut-offs used to reject thorium lines showing strong systematics (±10 m s−1 yr−1 for slope, ±0.3 for Pearson correlation coefficient, and < 1.5 for RV residual rms over error in RV). The black histogram corresponds to the selection of lines used 99% of the time, and the orange one corresponds to the final selection used in the new DRS after rejecting lines using the different cut-offs.
Current usage metrics show cumulative count of Article Views (full-text article views including HTML views, PDF and ePub downloads, according to the available data) and Abstracts Views on Vision4Press platform.
Data correspond to usage on the plateform after 2015. The current usage metrics is available 48-96 hours after online publication and is updated daily on week days.
Initial download of the metrics may take a while.