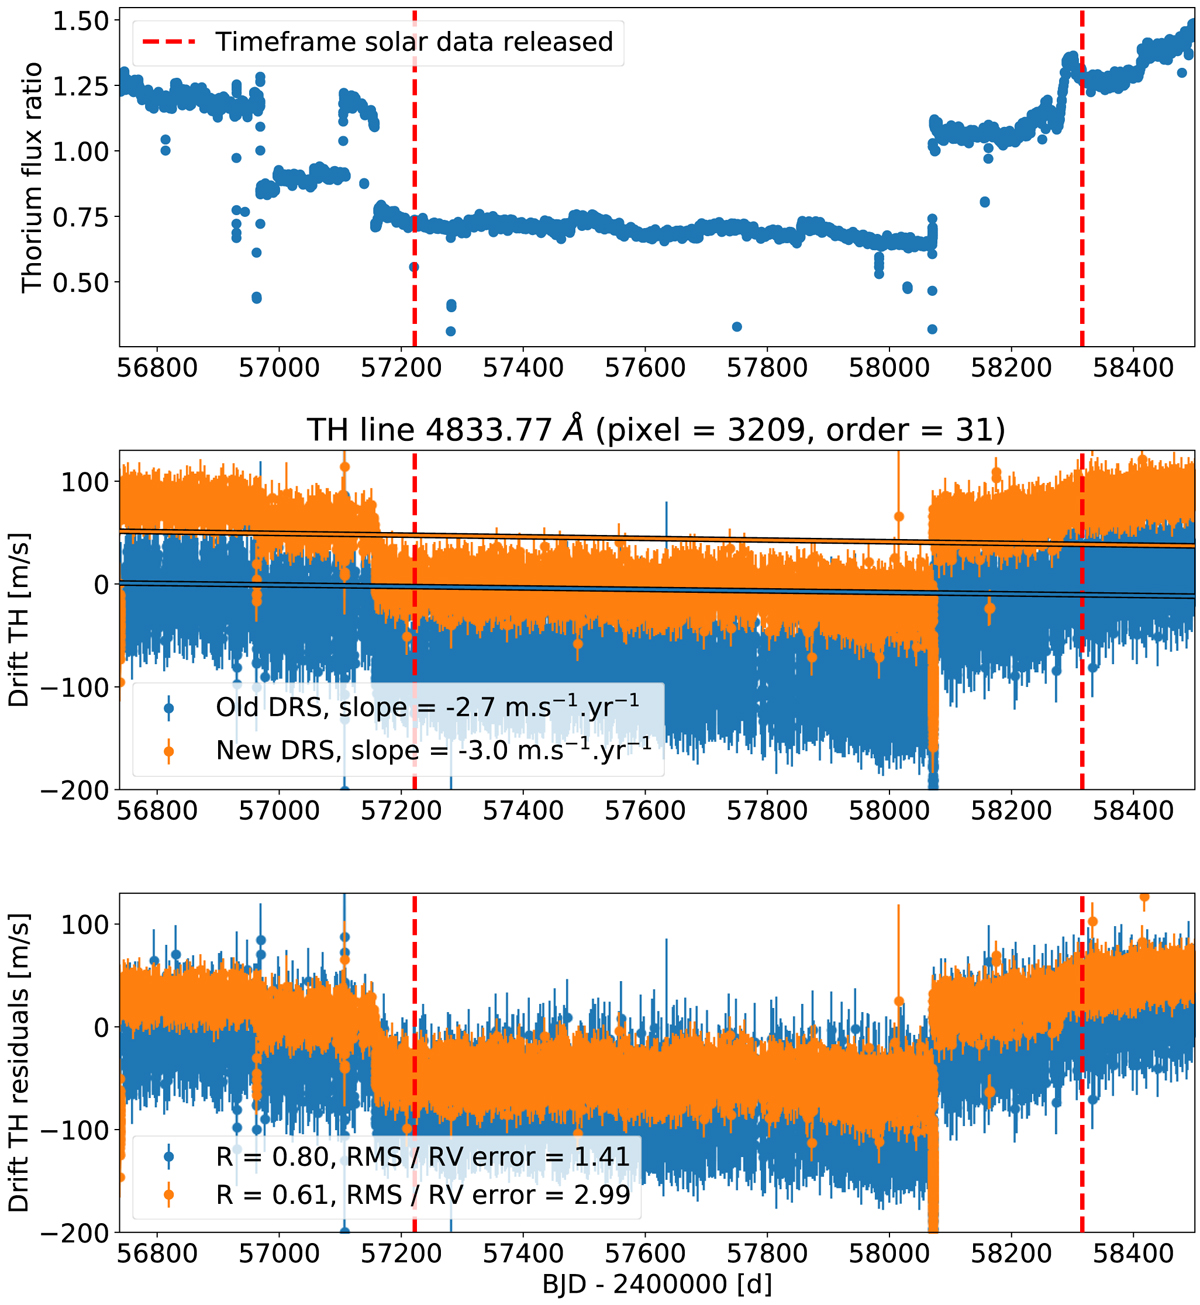
Fig. C.1.

Top: thorium flux ratio as a function of time, which is the total flux emitted by the thorium lamp at a given time relative to a reference time. Middle: RV drift of the thorium line at 4833.77 Å measured with the old (blue) and new (orange) DRS. On both data sets, we fitted a model corresponding to a linear drift plus a linear correlation with the thorium flux ratio. In the legend, we report the measured slope of the linear drift. Bottom: RV drift residuals after subtracting the fitted linear drift. In the legend, we report the R Pearson correlation coefficient between those residuals and the thorium flux ratio, as well as the ratio between the rms of those residuals and the median error in RV for this spectral line to detect a non-Gaussian behaviour.
Current usage metrics show cumulative count of Article Views (full-text article views including HTML views, PDF and ePub downloads, according to the available data) and Abstracts Views on Vision4Press platform.
Data correspond to usage on the plateform after 2015. The current usage metrics is available 48-96 hours after online publication and is updated daily on week days.
Initial download of the metrics may take a while.


