Fig. B.1.
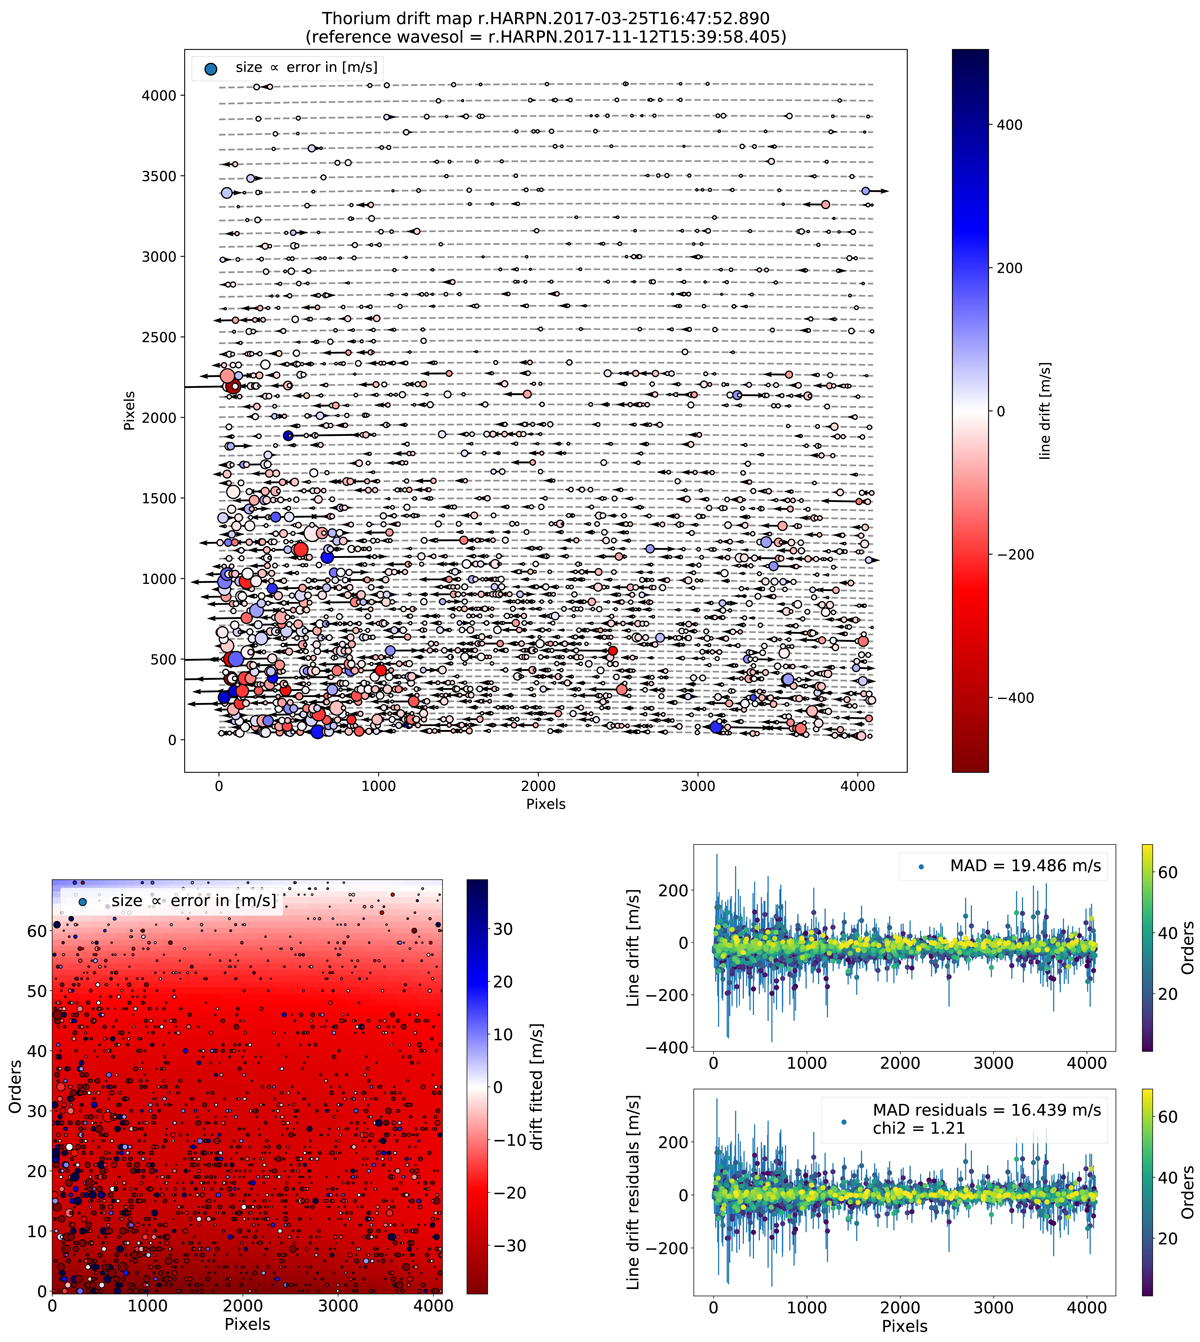
Derivation of the wavelength solution for the thorium calibration HARPN.2017-03-25T16-47-52.890.fits using the drift map method with the frame HARPN.2017-11-12T15:39:58.405.fits selected as a reference. Top: first, we measured the drift of all the thorium lines between those two calibrations. Each thorium line is represented as a dot with a size proportional to the error in drift and colour to the drift measured. We note that the thorium lines have been represented at their exact location on the detector using the localisation of the orders (grey dotted lines). Bottom left: then, we fitted a smooth two-dimensional polynomial on the measured drift of all the thorium lines. The corresponding wavelength solution was obtained by shifting the reference wavelength solution with the fitted two-dimensional polynomial. Bottom right: measured drift on the thorium lines between the thorium calibration and the reference before adjusting the two-dimensional polynomial (top) and after fitting for it (bottom). As we see, the χ2 of the two-dimensional polynomial fit is close to one, and the residuals show a scatter, which was measured with the MAD, which is significantly reduced.
Current usage metrics show cumulative count of Article Views (full-text article views including HTML views, PDF and ePub downloads, according to the available data) and Abstracts Views on Vision4Press platform.
Data correspond to usage on the plateform after 2015. The current usage metrics is available 48-96 hours after online publication and is updated daily on week days.
Initial download of the metrics may take a while.