Fig. 10.
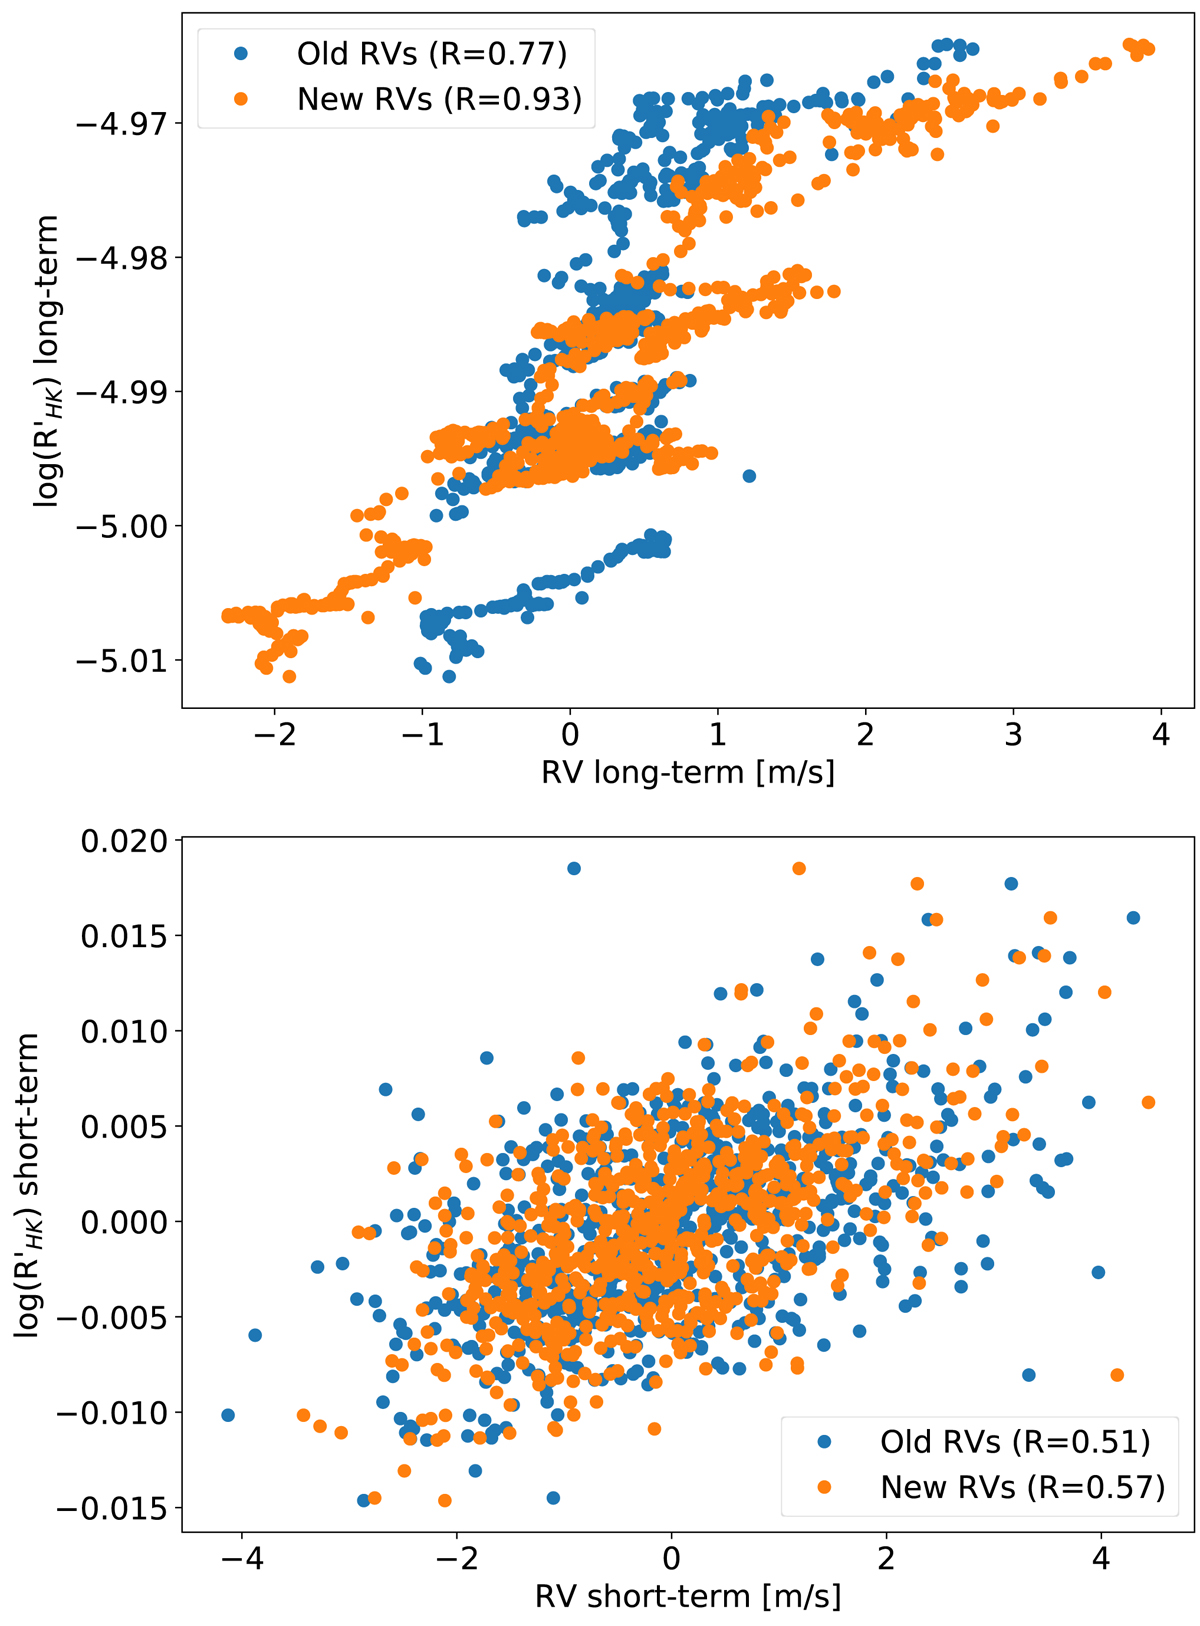
Top: correlation between the RVs and the log(![]() ) for long-term variations, which in this case means that the time series were smoothed using a 30-day rolling average. Bottom: correlation between the short-term variations, meaning the raw time series minus the smoothed ones. In the legend, we show the values for the R Pearson correlation coefficient for the new and old solar RVs.
) for long-term variations, which in this case means that the time series were smoothed using a 30-day rolling average. Bottom: correlation between the short-term variations, meaning the raw time series minus the smoothed ones. In the legend, we show the values for the R Pearson correlation coefficient for the new and old solar RVs.
Current usage metrics show cumulative count of Article Views (full-text article views including HTML views, PDF and ePub downloads, according to the available data) and Abstracts Views on Vision4Press platform.
Data correspond to usage on the plateform after 2015. The current usage metrics is available 48-96 hours after online publication and is updated daily on week days.
Initial download of the metrics may take a while.