Fig. 1.
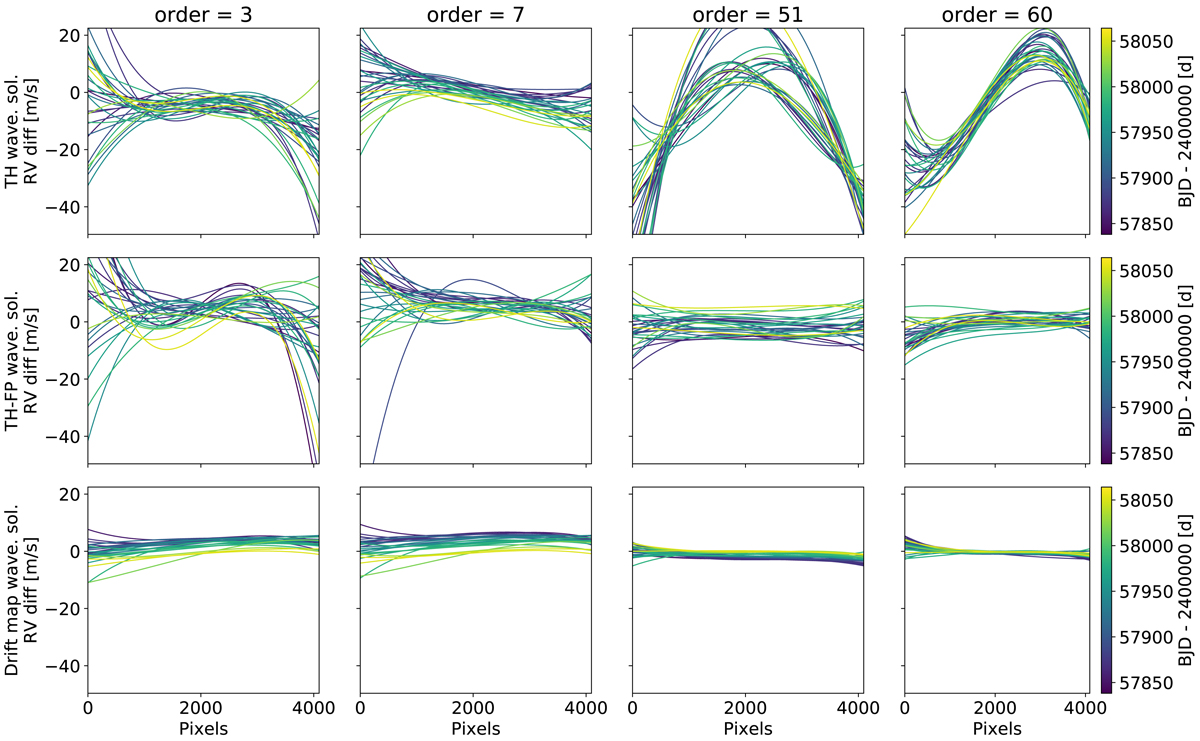
RV difference between wavelength solutions taken on different days when derived using different algorithms. The RV difference was obtained by comparing all the wavelength solutions with the wavelength solution of reference used in the drift map method, obtained on 2017 November 11. Each column corresponds to a different echelle order, highlighting the behaviour of the wavelength solutions from the blue (order 3) to the red (order 60). Top: RV difference when using only the thorium lines (TH). This is what is done in the old HARPS-N DRS. Middle: RV difference when using thorium lines and the Fabry-Pérot spectrum (TH–FP). Bottom: RV difference when using the drift map method presented in this paper, which means using a reference wavelength solution, and shifting it in velocity after measuring the drift of the thorium lines.
Current usage metrics show cumulative count of Article Views (full-text article views including HTML views, PDF and ePub downloads, according to the available data) and Abstracts Views on Vision4Press platform.
Data correspond to usage on the plateform after 2015. The current usage metrics is available 48-96 hours after online publication and is updated daily on week days.
Initial download of the metrics may take a while.