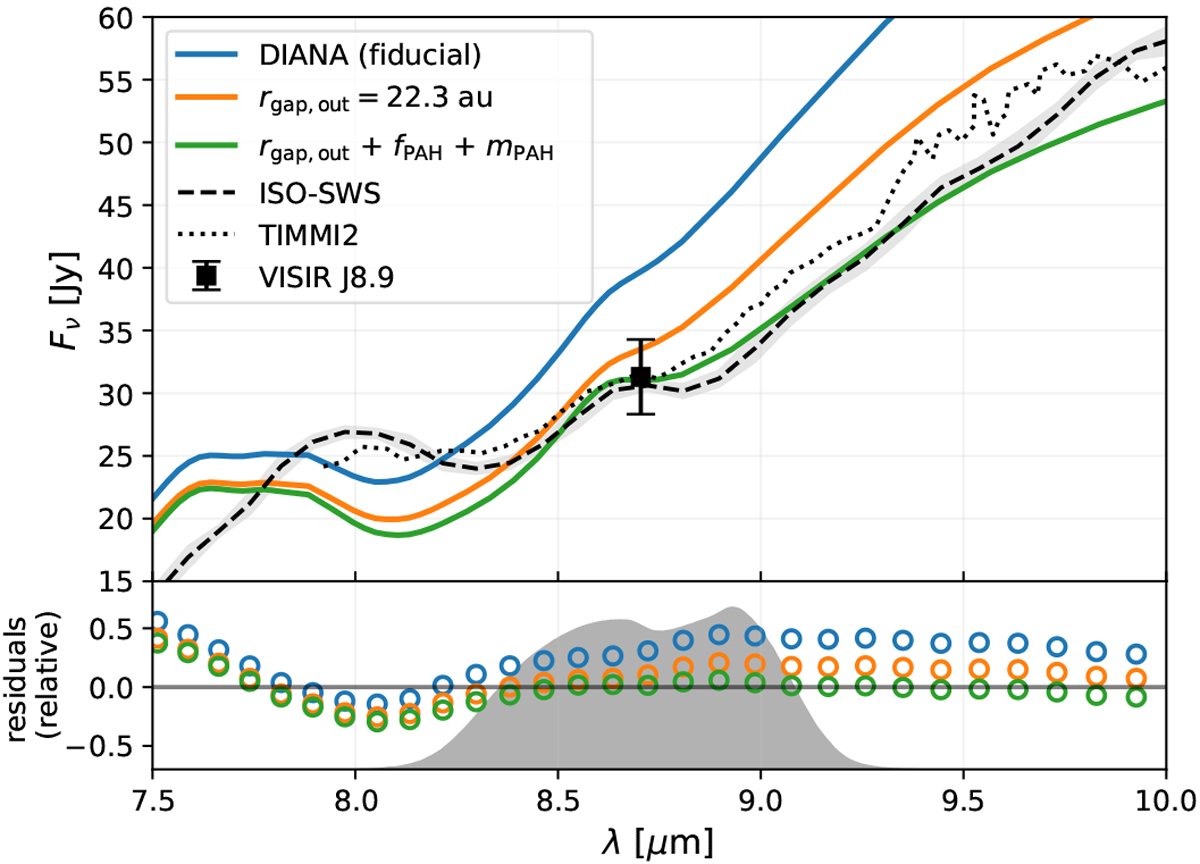
Fig. 5

Comparison between the fiducial PRODIMO HD 100546 disk model (Woitke et al. 2019) and multi-parameter variants of the model. We include the observational VISIR data corrected for sky transmission and additional observational data (Malfait et al. 1998; van Boekel et al. 2004; Ishihara et al. 2010). The grey filled area illustrates the J8.9 filter response curve (arbitrary vertical scaling). Residuals between the various disk models and the ISO-SWS spectrum are shown in the lower panel as the ratio between the model SED and the observed spectrum.
Current usage metrics show cumulative count of Article Views (full-text article views including HTML views, PDF and ePub downloads, according to the available data) and Abstracts Views on Vision4Press platform.
Data correspond to usage on the plateform after 2015. The current usage metrics is available 48-96 hours after online publication and is updated daily on week days.
Initial download of the metrics may take a while.


